
Bitcoin's Coinbase Premium Index Turns Negative Amid Price Drop
Bitcoin's price decline leads to a negative shift in the Coinbase Premium Index, potentially indicating the start of a recovery phase.


The Bitcoin Coinbase Premium Index has turned negative as BTC’s price dropped below $104,000, aligning with the relative strength index (RSI) hitting its lowest since April, suggesting a potential recovery phase ahead.
Key Highlights:
- The Bitcoin Coinbase Premium turned red as BTC fell to $103,500, altering market sentiment.
- The relative strength index (RSI) has indicated potential bottoming out at 34, matching its April low.
- Maintaining the 200-day exponential moving average (EMA) is critical to avoid short-term capitulation, with potential risks looming.
Bitcoin (BTC) faced a decline on Friday, leading to an important shift in onchain market sentiment. The Coinbase Premium Index, which tracks the price difference of Bitcoin between the Coinbase and other exchanges, has for the first time in weeks gone negative on an hourly basis.
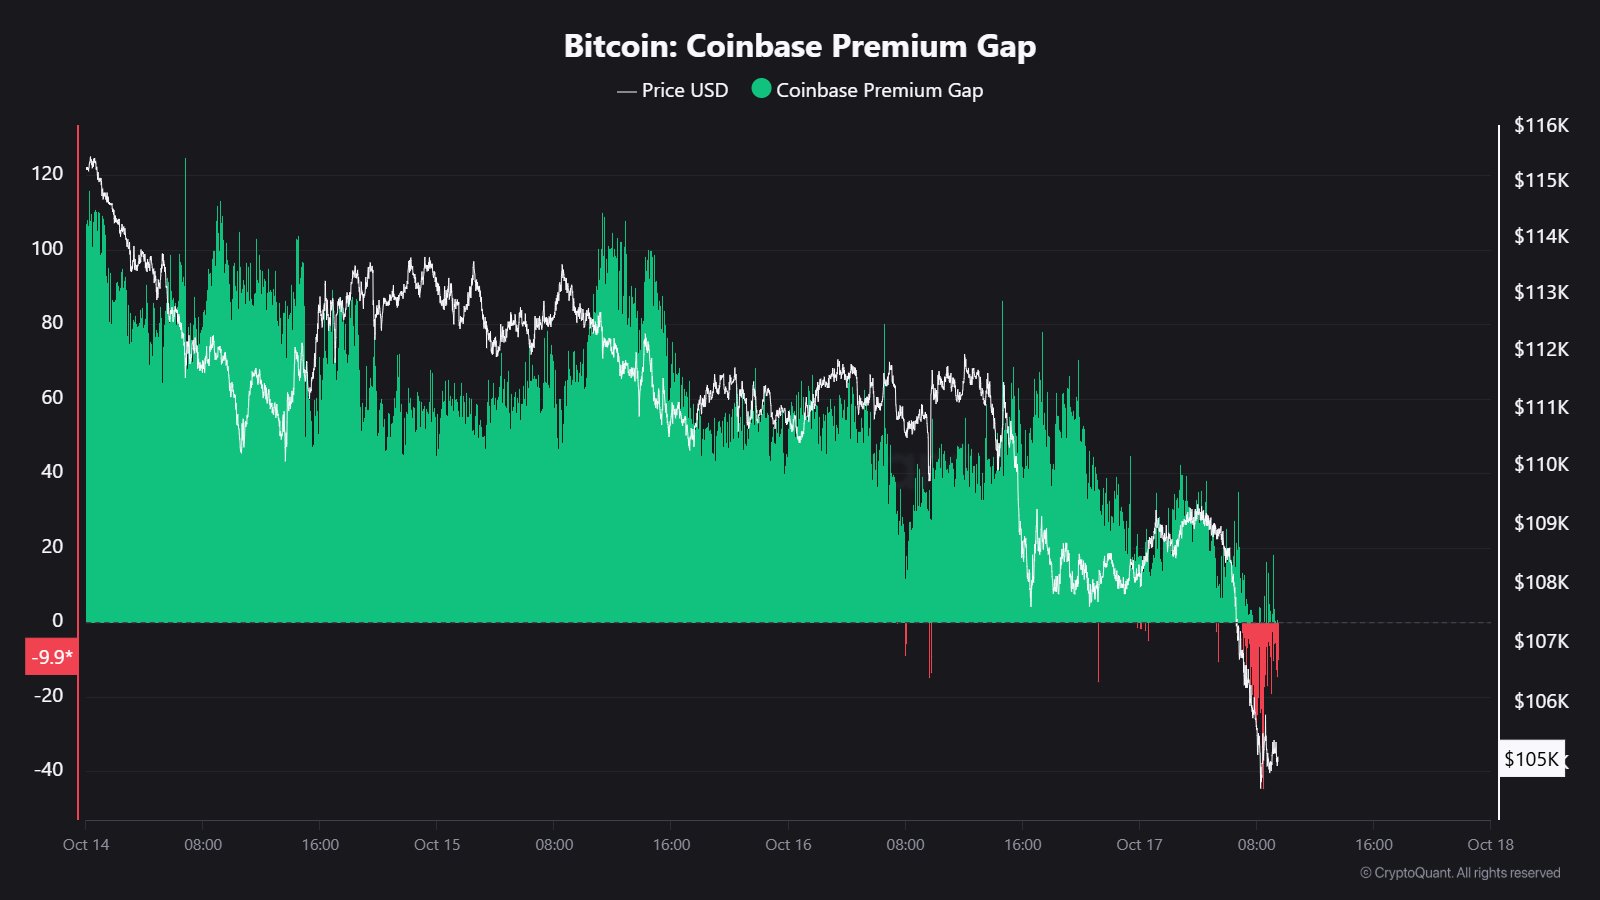 Bitcoin Coinbase Premium Gap. Source: X
Earlier in the week, BTC attempted to maintain support around $110,000 with robust demand from US investors, at one point causing the Coinbase Premium to hit its highest since March 2024.
However, the failure to sustain above the $110,000 mark on Thursday diminished short-term confidence. Despite the hourly premium turning negative, the daily reading remained positive, suggesting long-term US buying interests are under pressure but not entirely extinguished.
Adding to bearish sentiment, Bitcoin’s taker sell volume surged over $4 billion, indicating significant sell queries, which correlated with BTC’s cautious approach near the realized price of short-term holders.
Historically, failure to consolidate above the recent lows could expedite a downturn toward the $100,000 threshold.
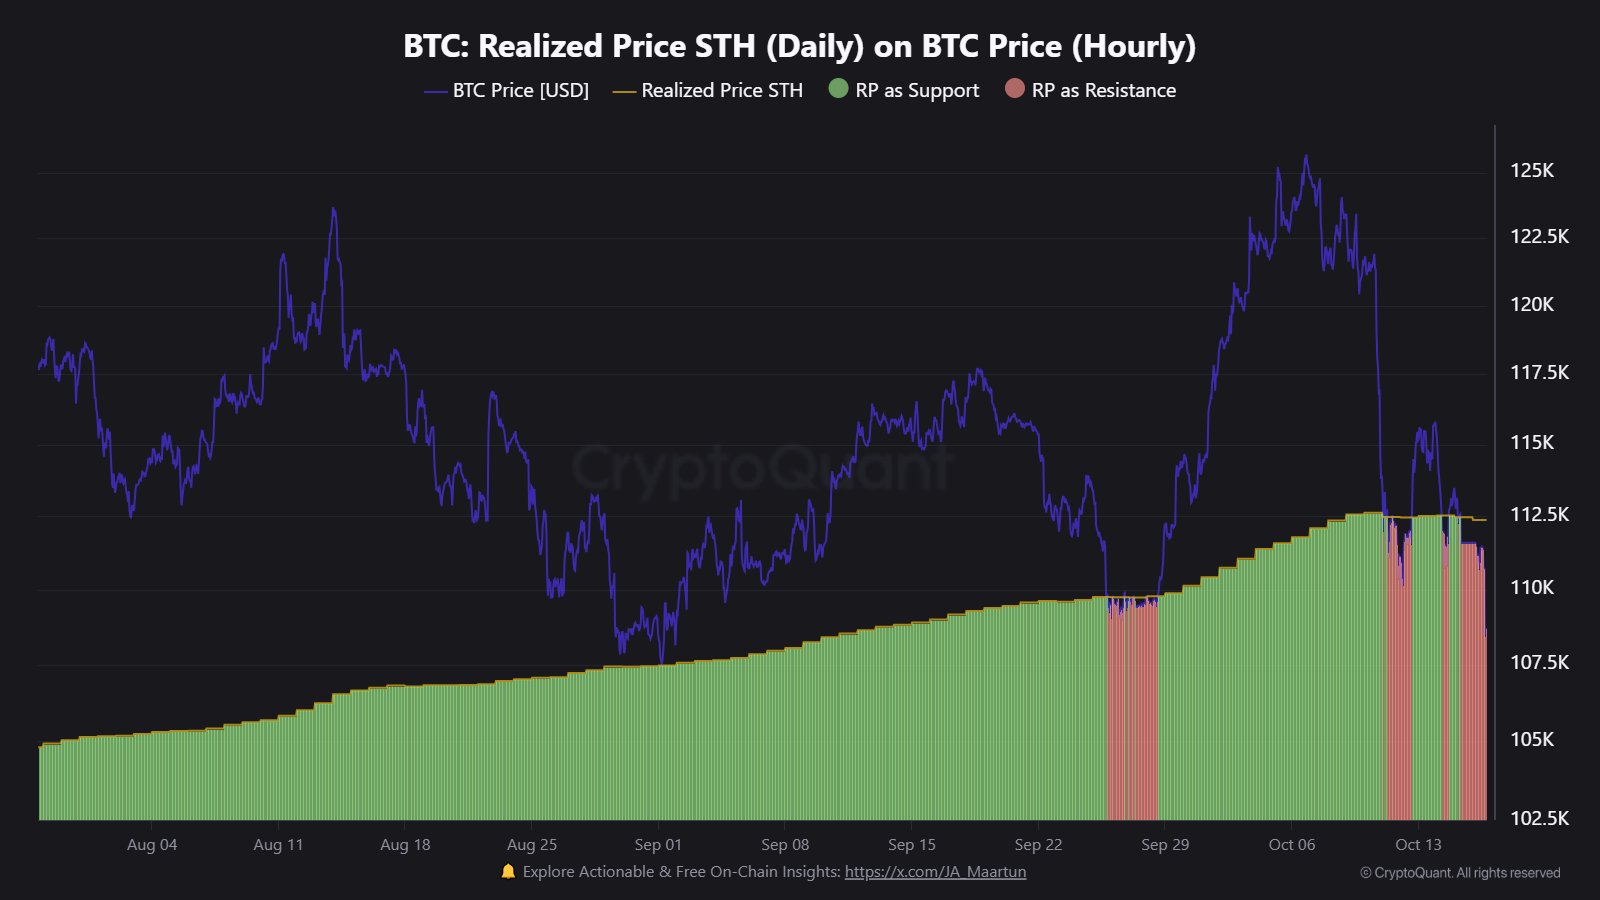 Bitcoin realized price for short-term holders. Source: X
BTC Price Action Resembles Previous Bottom
BTC’s price走势 now mirrors the patterns of March-April, where intra-day fluctuations cleared liquidity built up before a recovery. This suggests that a retest of the $100,000 range is viable without disrupting the broader upward trend unless the price decisively breaches that level.
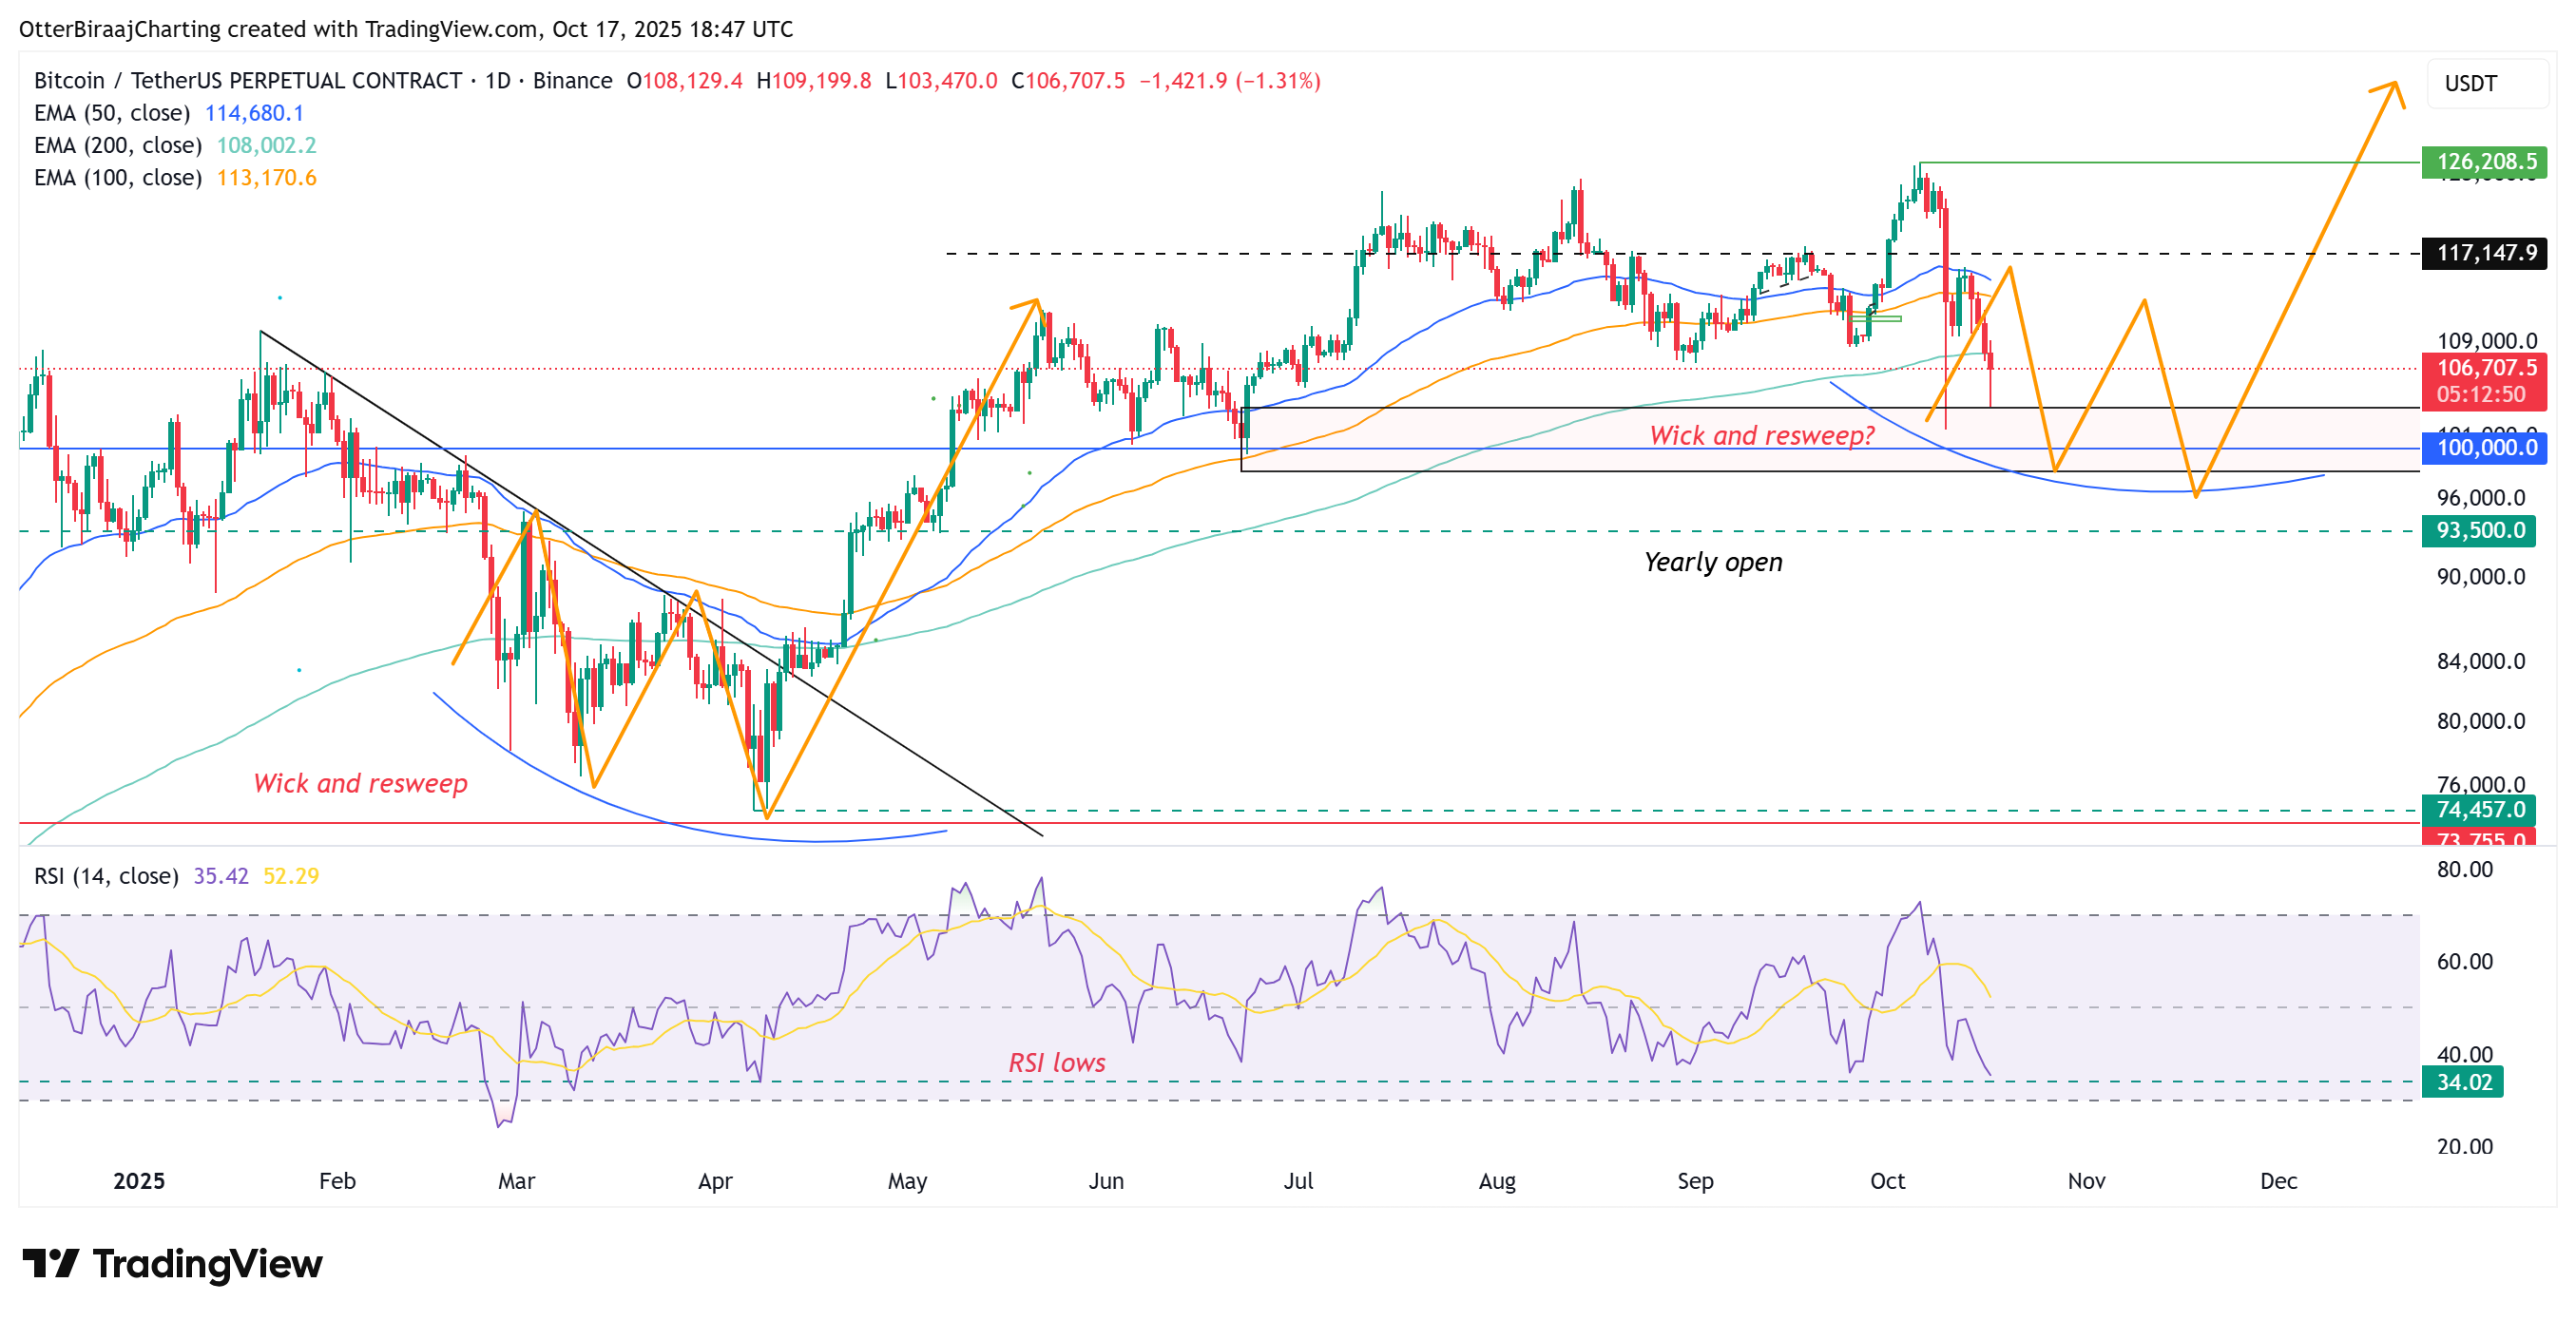 Bitcoin one-day chart. Source: Cointelegraph/TradingView
The crucial 200-day EMA has been maintained over several months, a trend witnessed in previous cycles. The ongoing trends indicate that there might be a consolidation period ahead, with historical patterns hinting at potential recovery nearing late November or early December.
Crypto trader Dentoshi noted, “BTC has consistently bottomed around the 3-day 100 EMA this bull run—but it’s taken 45–96 days to do so.”
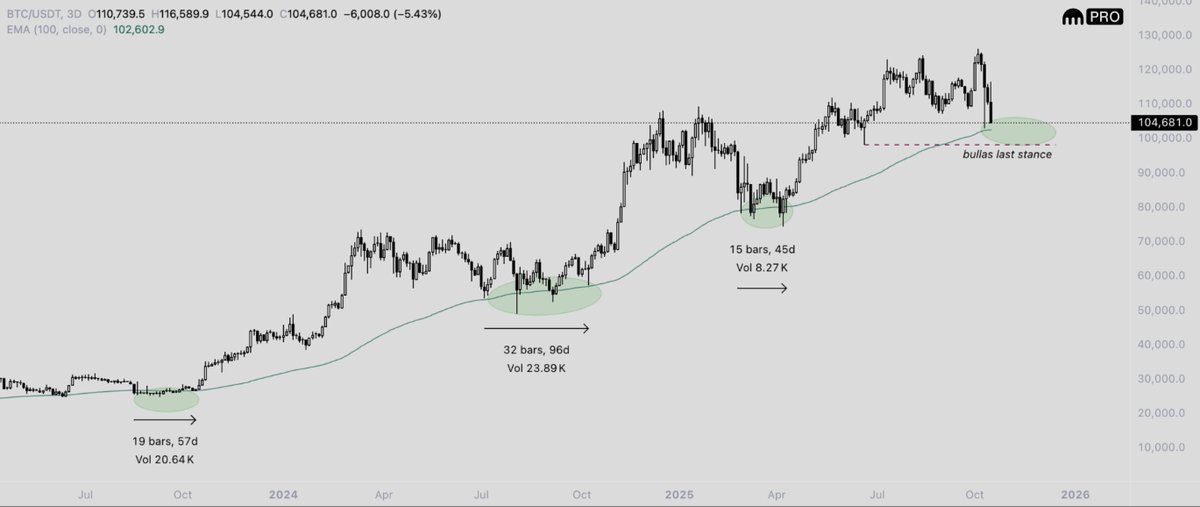 Bitcoin three-day chart analysis Source: Dentoshi/X
This article does not provide investment advice. All investment decisions carry inherent risks; readers should conduct their own research.
