
Will Ethereum Prices Surpass $4,500 This October?
Ethereum may aim for a price of $4,500 as bullish patterns emerge this month.


Ethereum’s price is closely looking at the $4,500 level as classic chart patterns align with on-chain MVRV statistics, signaling a potential upward movement this month.
Highlights:
- Ether’s recovery from a critical support area brings $4,500 within sight.
- MVRV bands indicate ETH is maintaining above the support level, aiming for a surge to $5,000.
Ethereum’s cryptocurrency, Ether (ETH), has bounced back by over 15% after hitting its lows at $3,435 approximately two weeks ago. Several indicators suggest that ETH might continue its upward trend towards $4,500 as October progresses.
Bull Flag Bounce for ETH
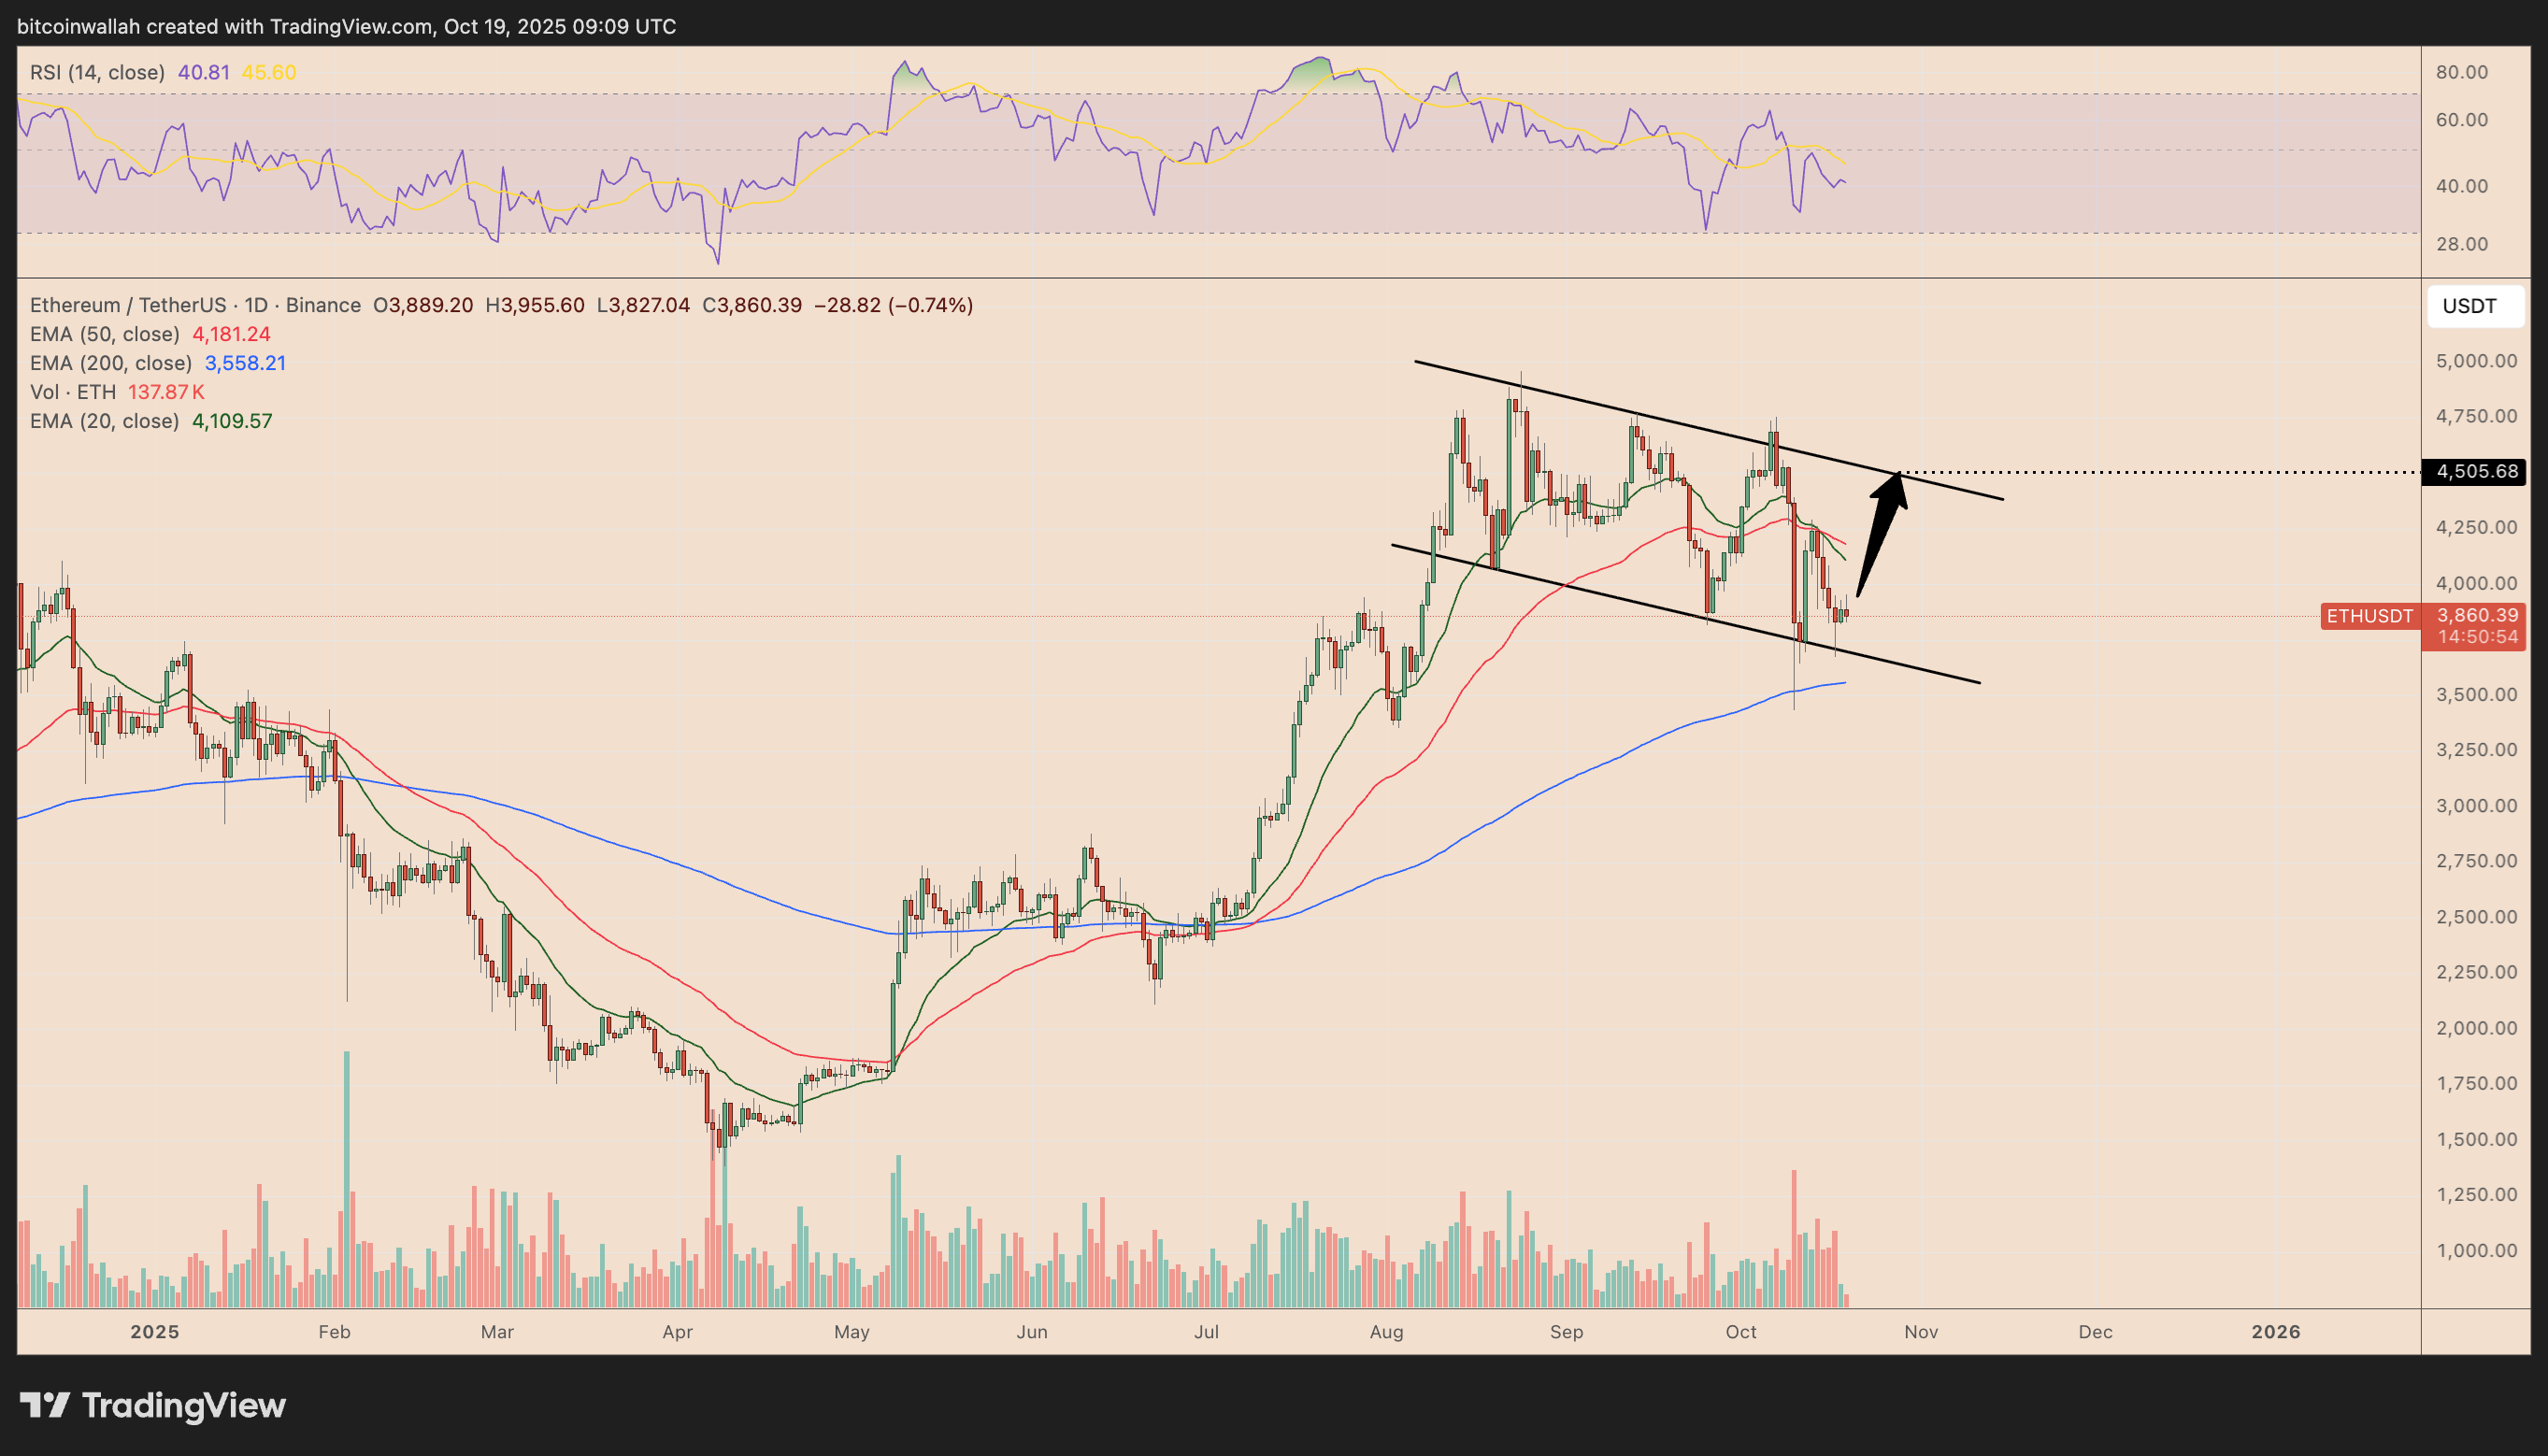
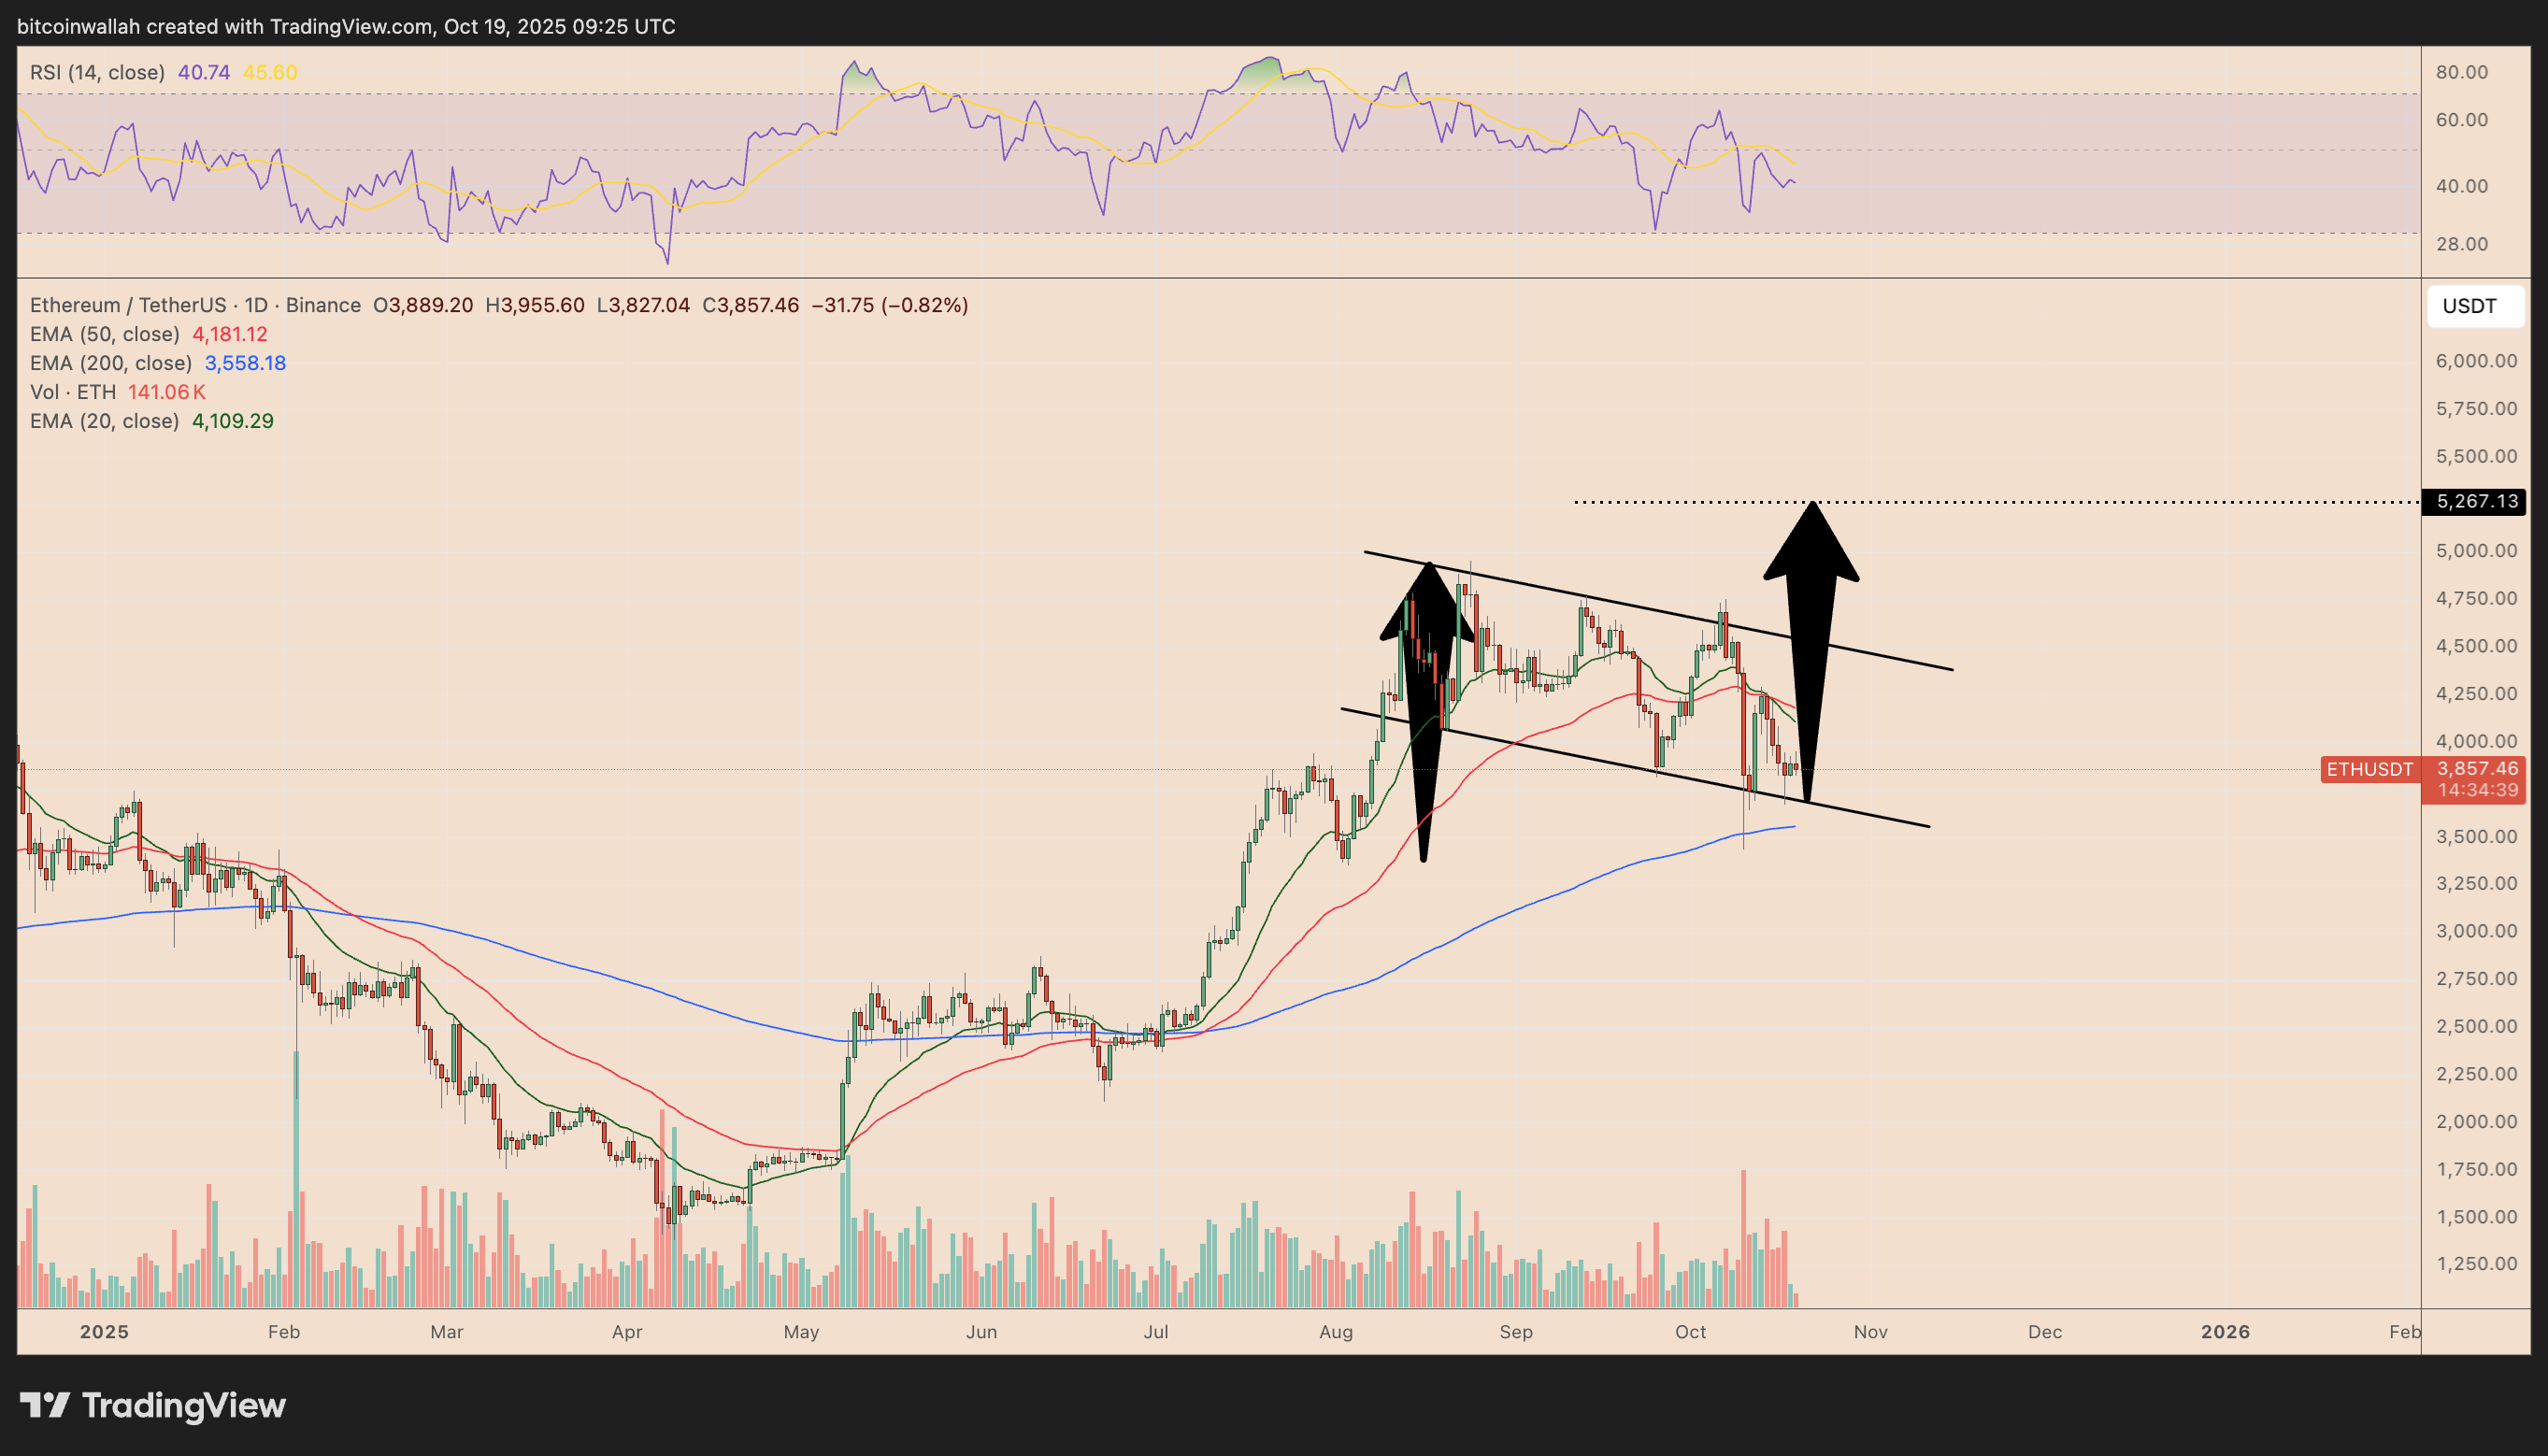
The rebound in ETH seems to align with the formation of a bull flag pattern, which generally indicates a continuation of the current uptrend after a brief consolidation.
The flag structure for ETH can be seen as a descending parallel channel, following a significant increase from around $2,500 in April to a high of approximately $4,950 in August.
 ETH/USDT daily chart. Source: TradingView
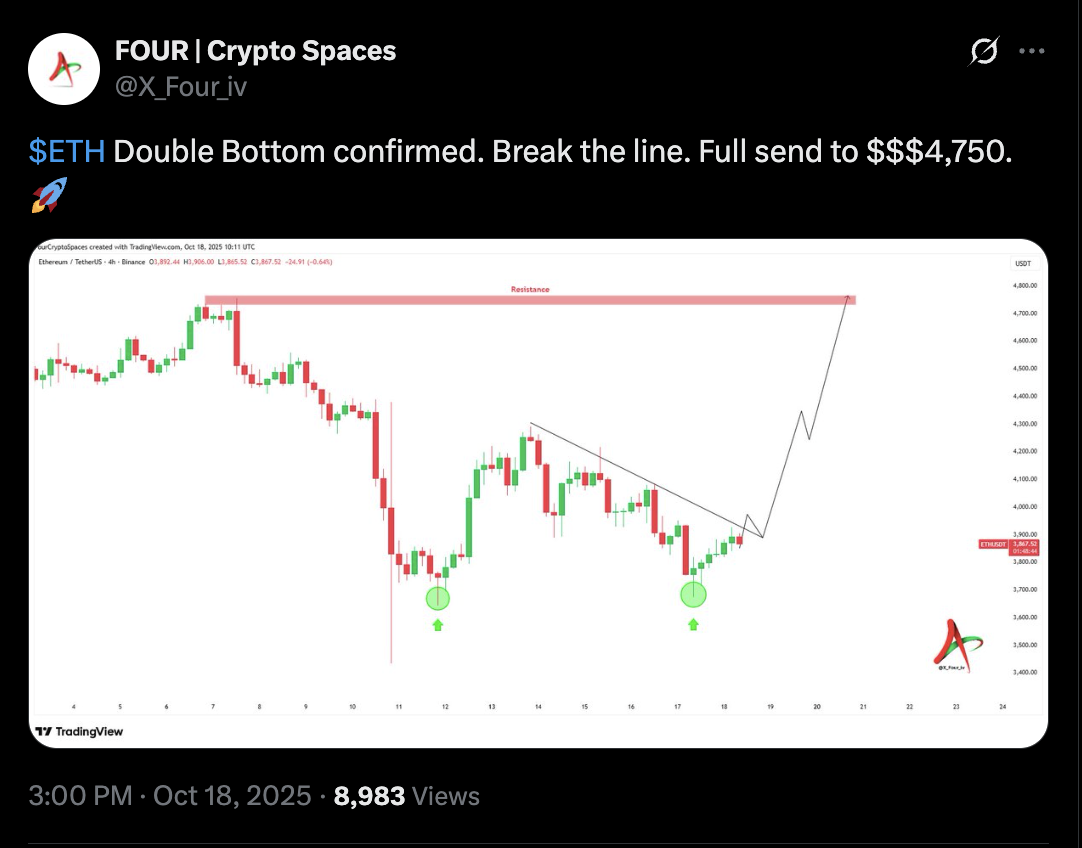
The current bounce from the channel’s lower edge near $3,500 aligns with support from the 200-day EMA, a level historically favored by buyers during bull markets. If momentum persists, ETH could target a breakout towards the channel’s upper range near $4,450-$4,500 in October. This interim target is supported by analyst FOUR’s double bottom formation, predicting ETH might encounter resistance at $4,750 shortly.
 Source: X
Trader Luca also forecasted an ETH rally heading towards the $4,500 mark, considering it holds above this weekly bull market support area.
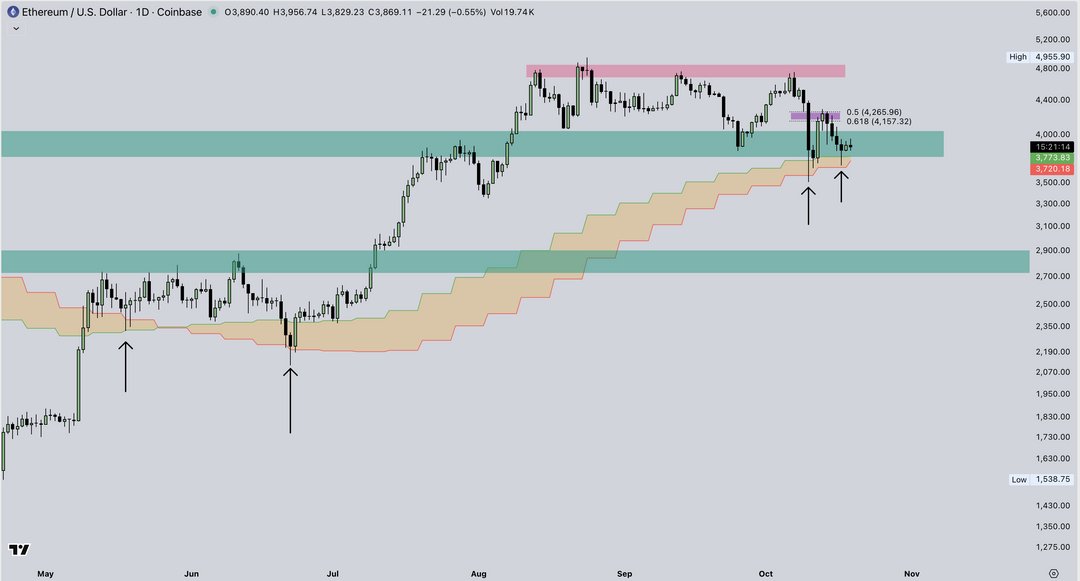 ETH/USD daily chart. Source: X/@CrypticTrades_
Should it surpass this zone, the pricing could rise to a bull flag target beyond $5,200, potentially reaching record highs by November.
 ETH/USDT daily chart. Source: TradingView
A decline below the support confluence, the bull flag’s lower boundary, and the 200-day EMA support around $3,550, may invalidate this pattern, pushing ETH down towards levels of $3,000-$3,200.
MVRV Data Reaffirms $4,500 Target
The MVRV Extreme Deviation Pricing Bands for Ethereum indicate that after a recent downturn, stability has returned near the mean level of around $3,900, historically serving as a springboard for new rallies.
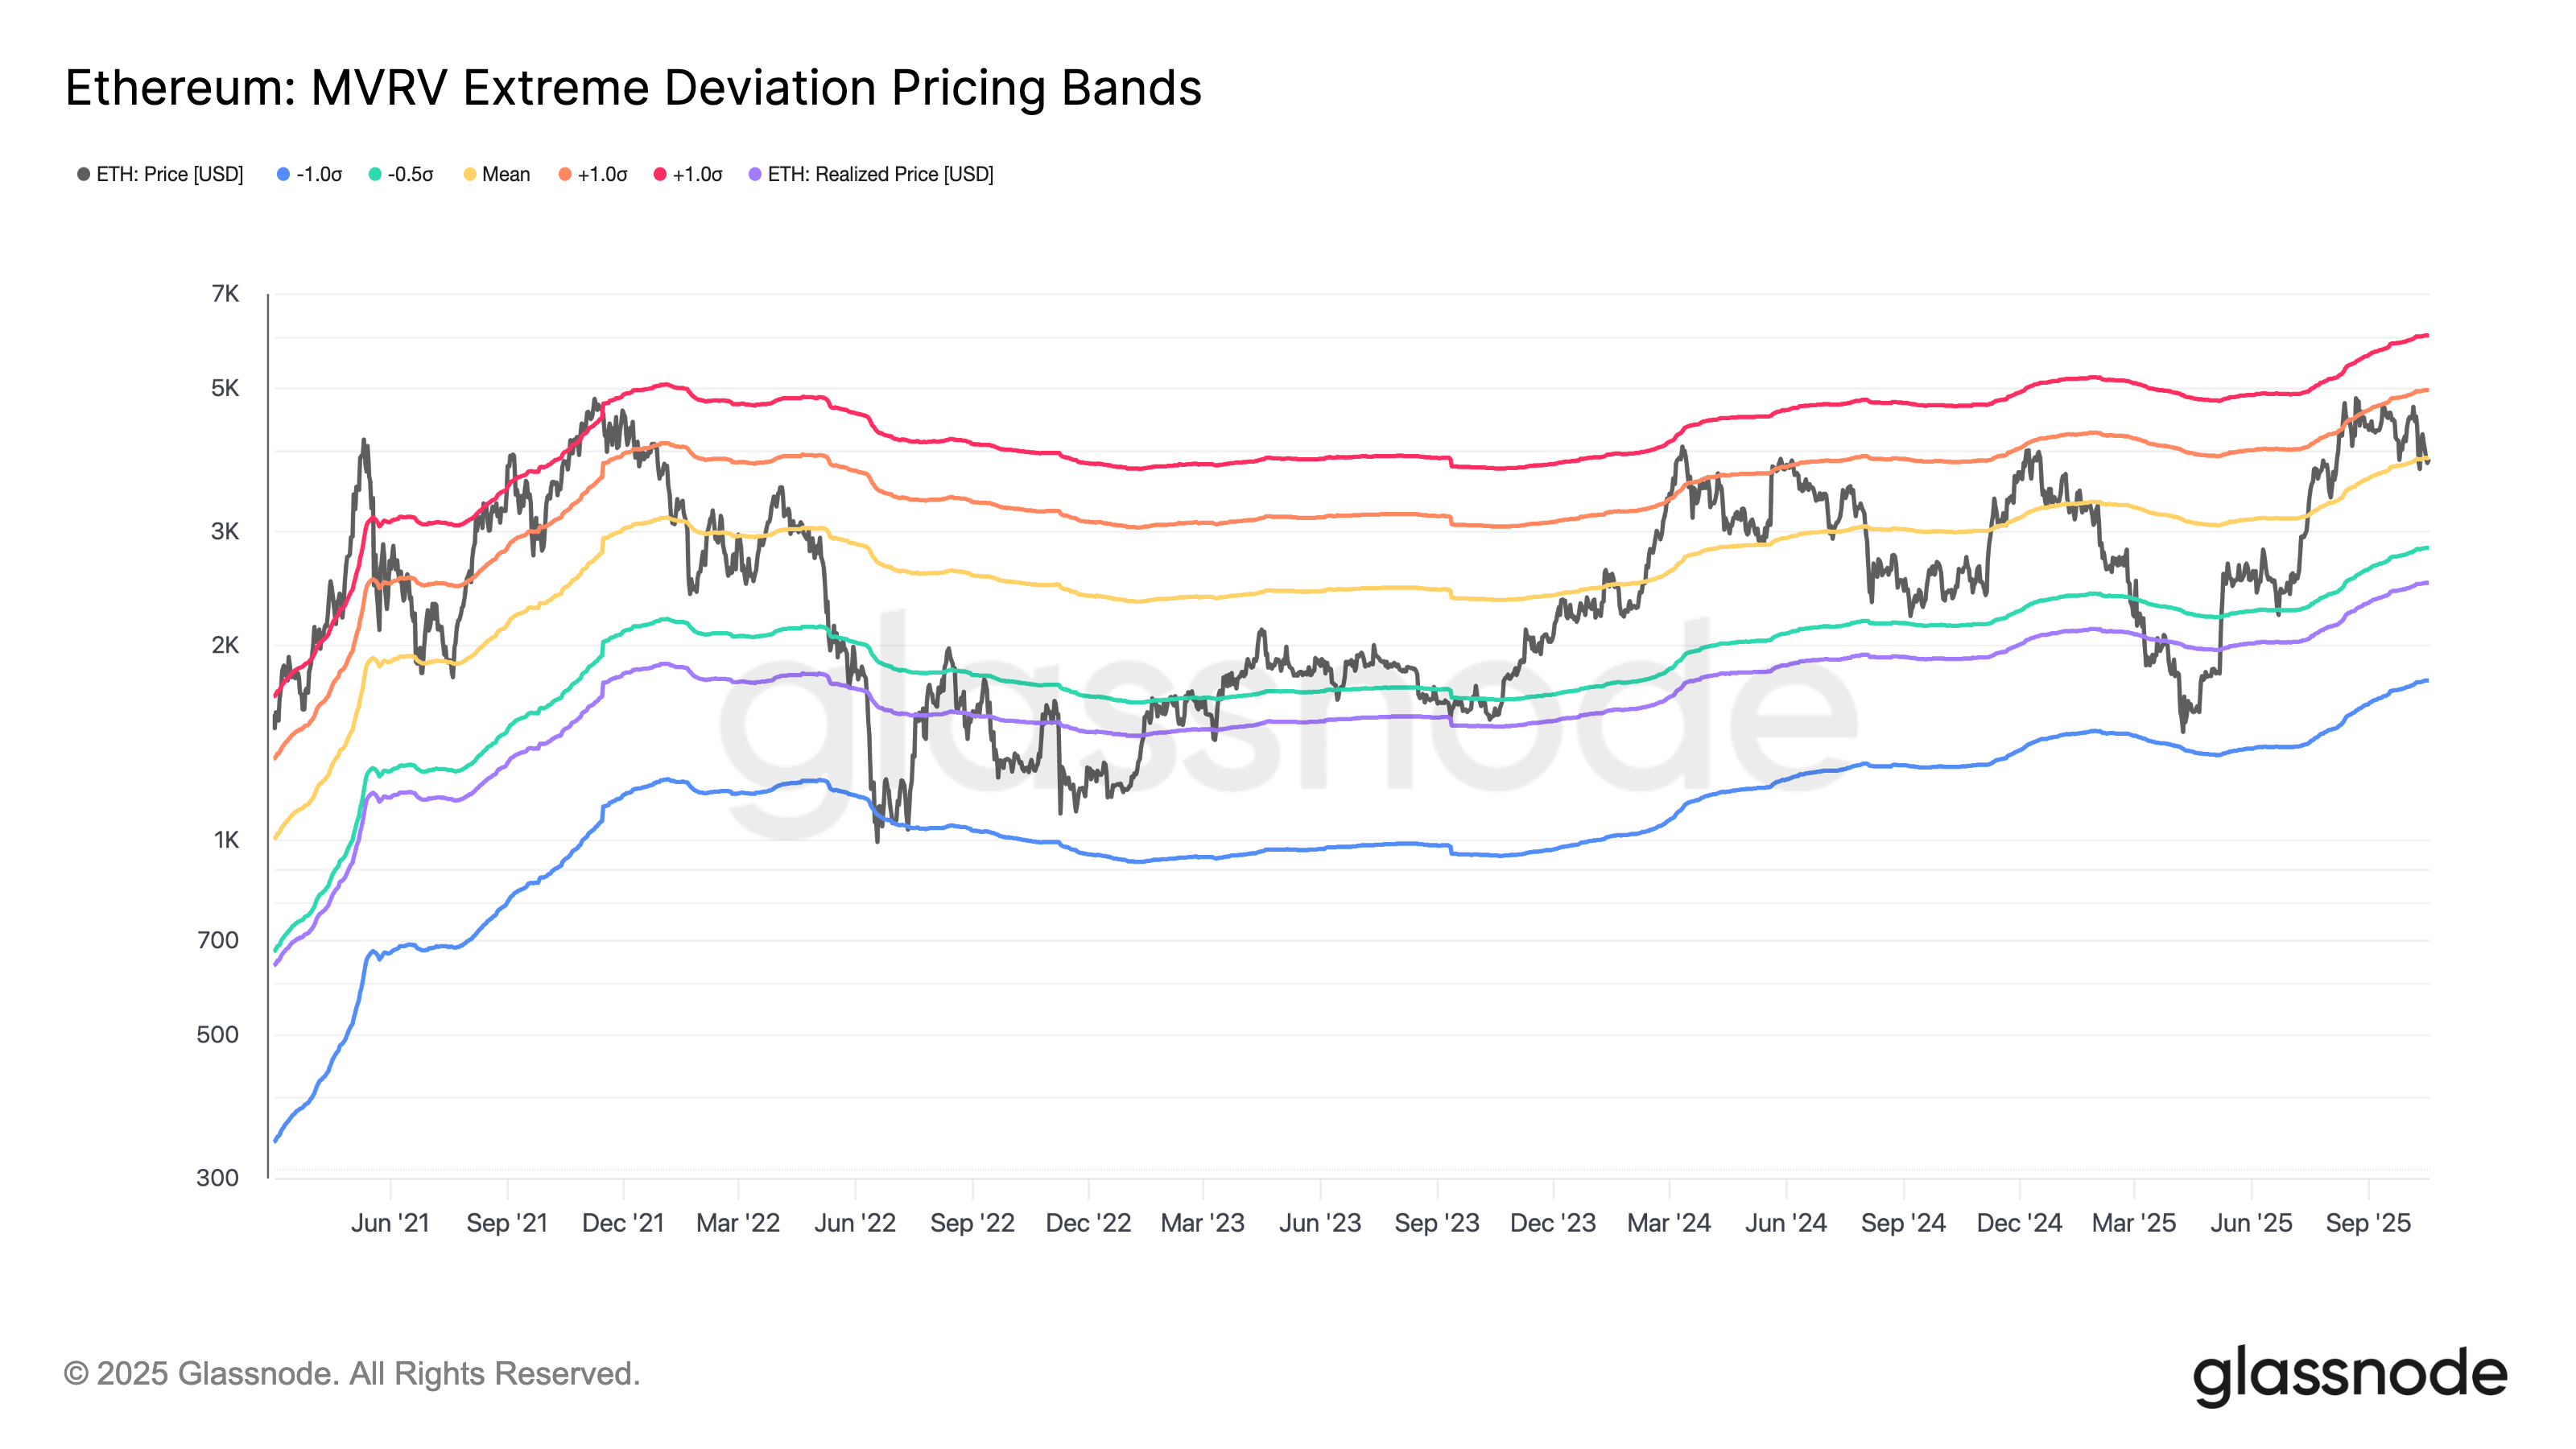 Ethereum MVRV extreme deviation pricing bands. Source: Glassnode
This pattern indicates that ETH might still be in a ‘healthy correction’ phase of its current bullish cycle rather than showing signs of exhaustion. If the mean level can maintain as support, a rally towards the $4,500-$5,000 range by late October becomes statistically likely.
This information is not intended as investment advice. All investments and trading involve risk; hence, individuals should perform their own research when making decisions.
