


Key Takeaways:
- The Bitcoin Coinbase Premium has flipped to negative as the BTC price dipped below $104,000.
- Bitcoin’s RSI dropped to its lowest point since April, indicating a possible bottoming trend.
- The ongoing support at the 200-day EMA is critical as Bitcoin faces short-term capitulation risks.
Bitcoin (BTC) further declined on Friday, reaching $103,500 and resulting in significant changes in on-chain market sentiment. For the first time in weeks, the Bitcoin Coinbase Premium Index—the measure of the price difference between BTC on Coinbase and other exchanges—registered a red signal on the hourly chart.
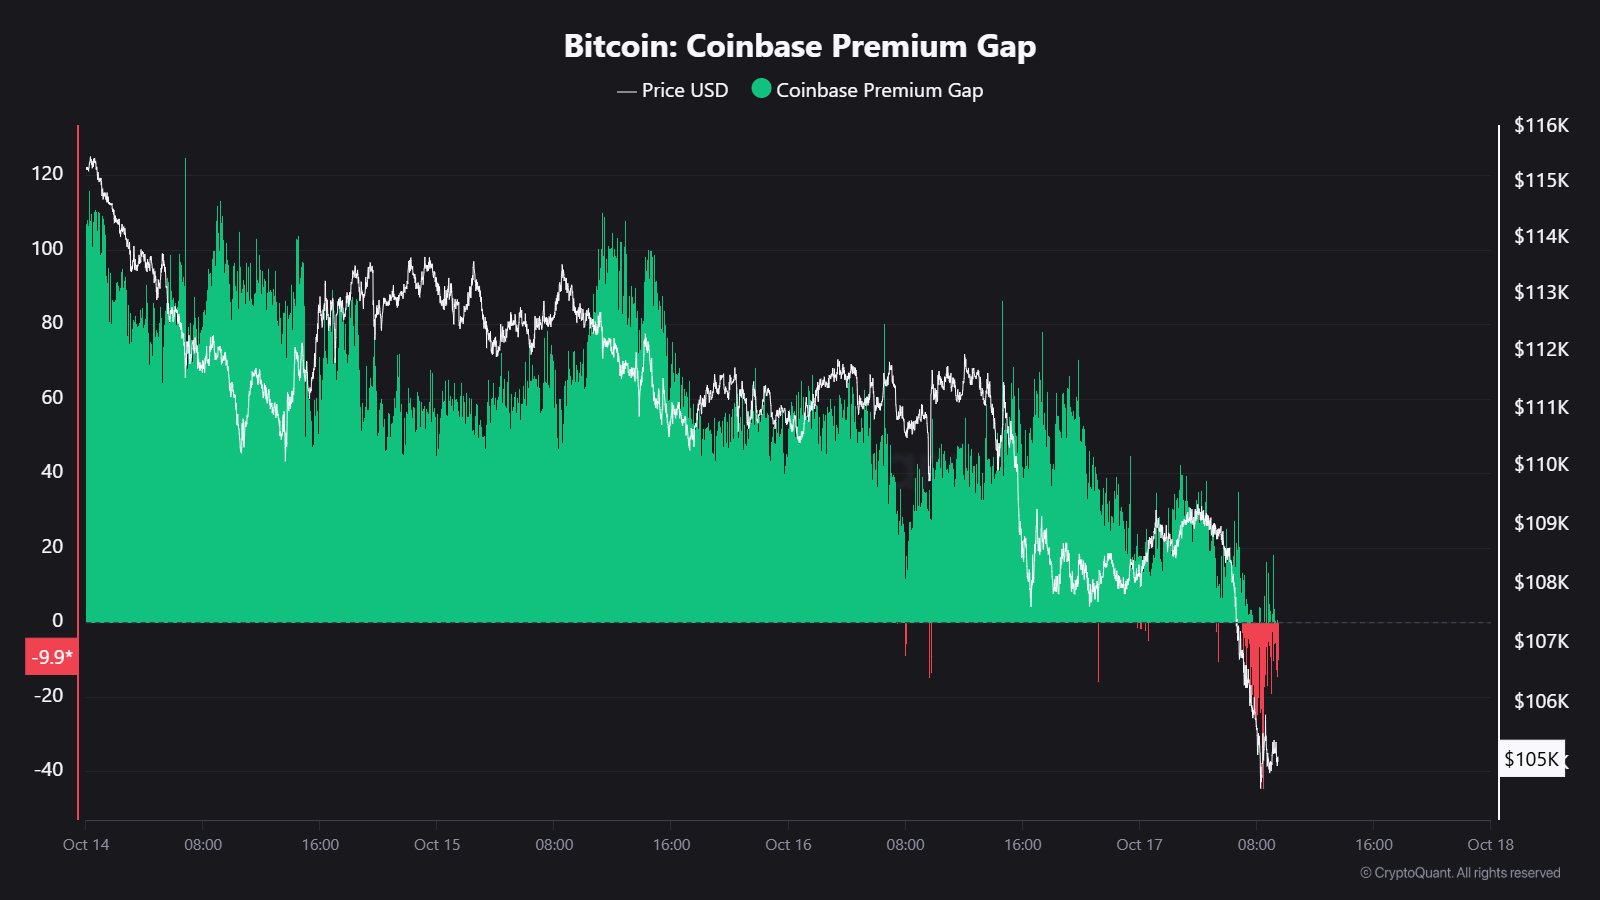 Bitcoin Coinbase Premium Gap. Source: X
Earlier in the week, BTC had tried to stabilize around $110,000, boosted by consistent demand from U.S. investors, with the Coinbase premium peaking at 0.18, marking its highest since March 2024.
However, when the price could not maintain above $110,000 by Thursday, that short-term optimism waned. The hourly premium has turned negative, while the daily reading remains slightly in the positive zone, suggesting that long-term support from U.S. buyers has not completely diminished but is currently under pressure.
In addition to the bearish momentum, Bitcoin’s taker sell volume soared past $4 billion, indicating a surge in market sell orders. This move corresponds with BTC facing resistance near the short-term holder (STH) realized price at $112,370. Historically, this price has represented the average purchase price for recent buyers, and continued rejection below it could expedite short-term capitulation towards $100,000.
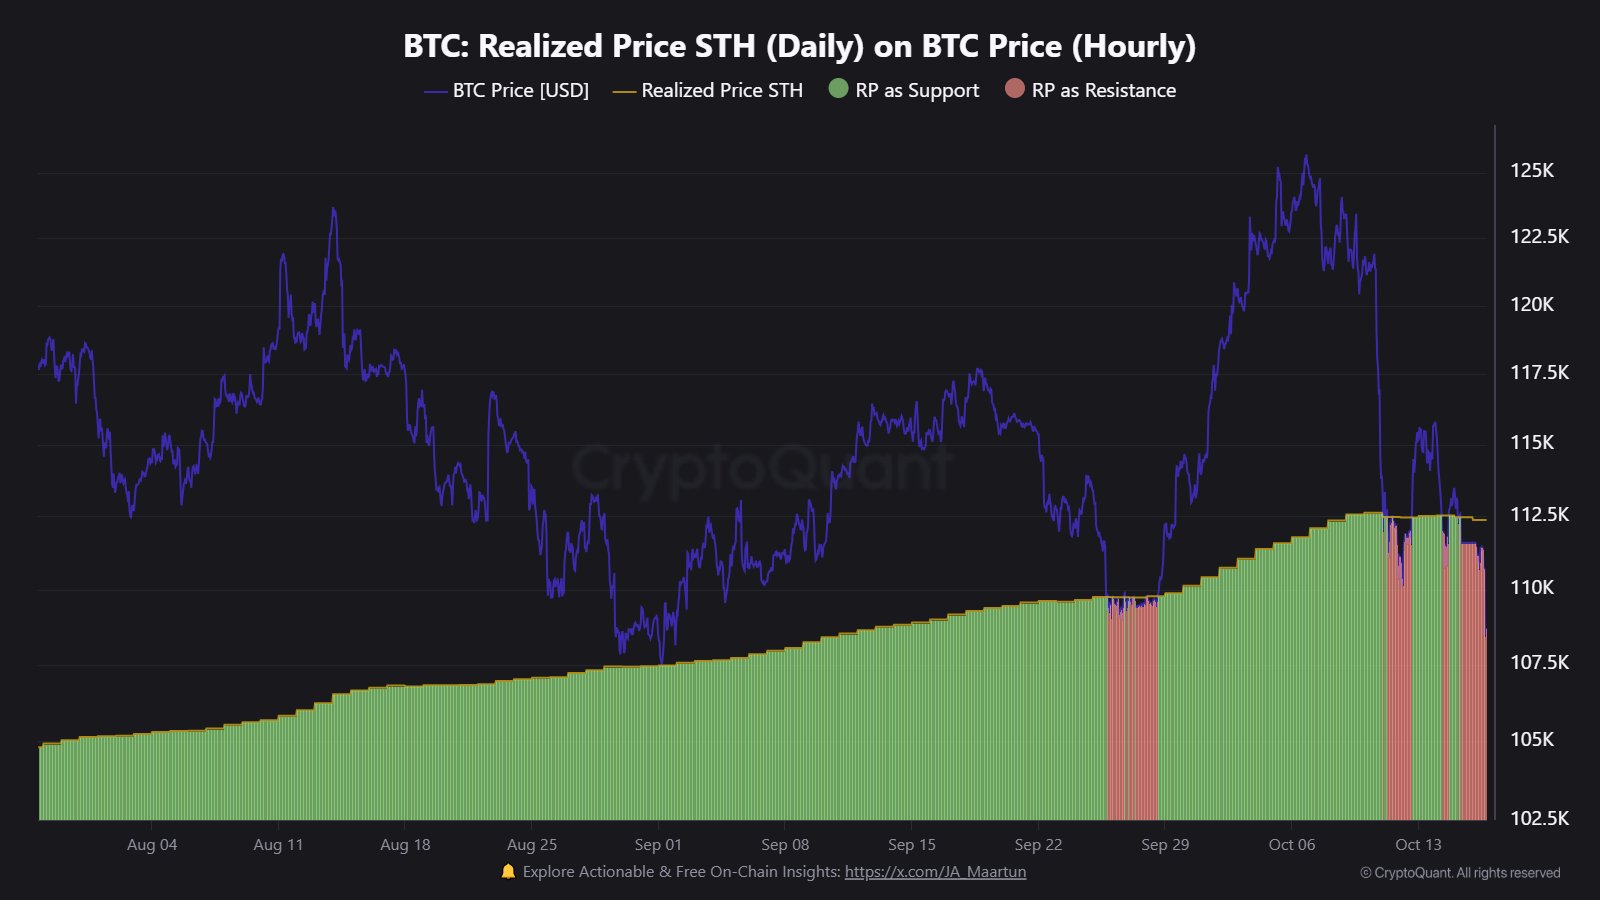 Bitcoin realized price for short-term holders. Source: X
Bitcoin Reflects Its March–April Bottom Pattern
BTC’s current market behavior is reminiscent of the March-April bottom period, where dramatic intraday fluctuations cleared previous liquidity and initiated a slow recovery. This pattern implies that BTC could revisit the $100,000 range without breaching the overall bullish trend unless it conclusively declines below that benchmark.
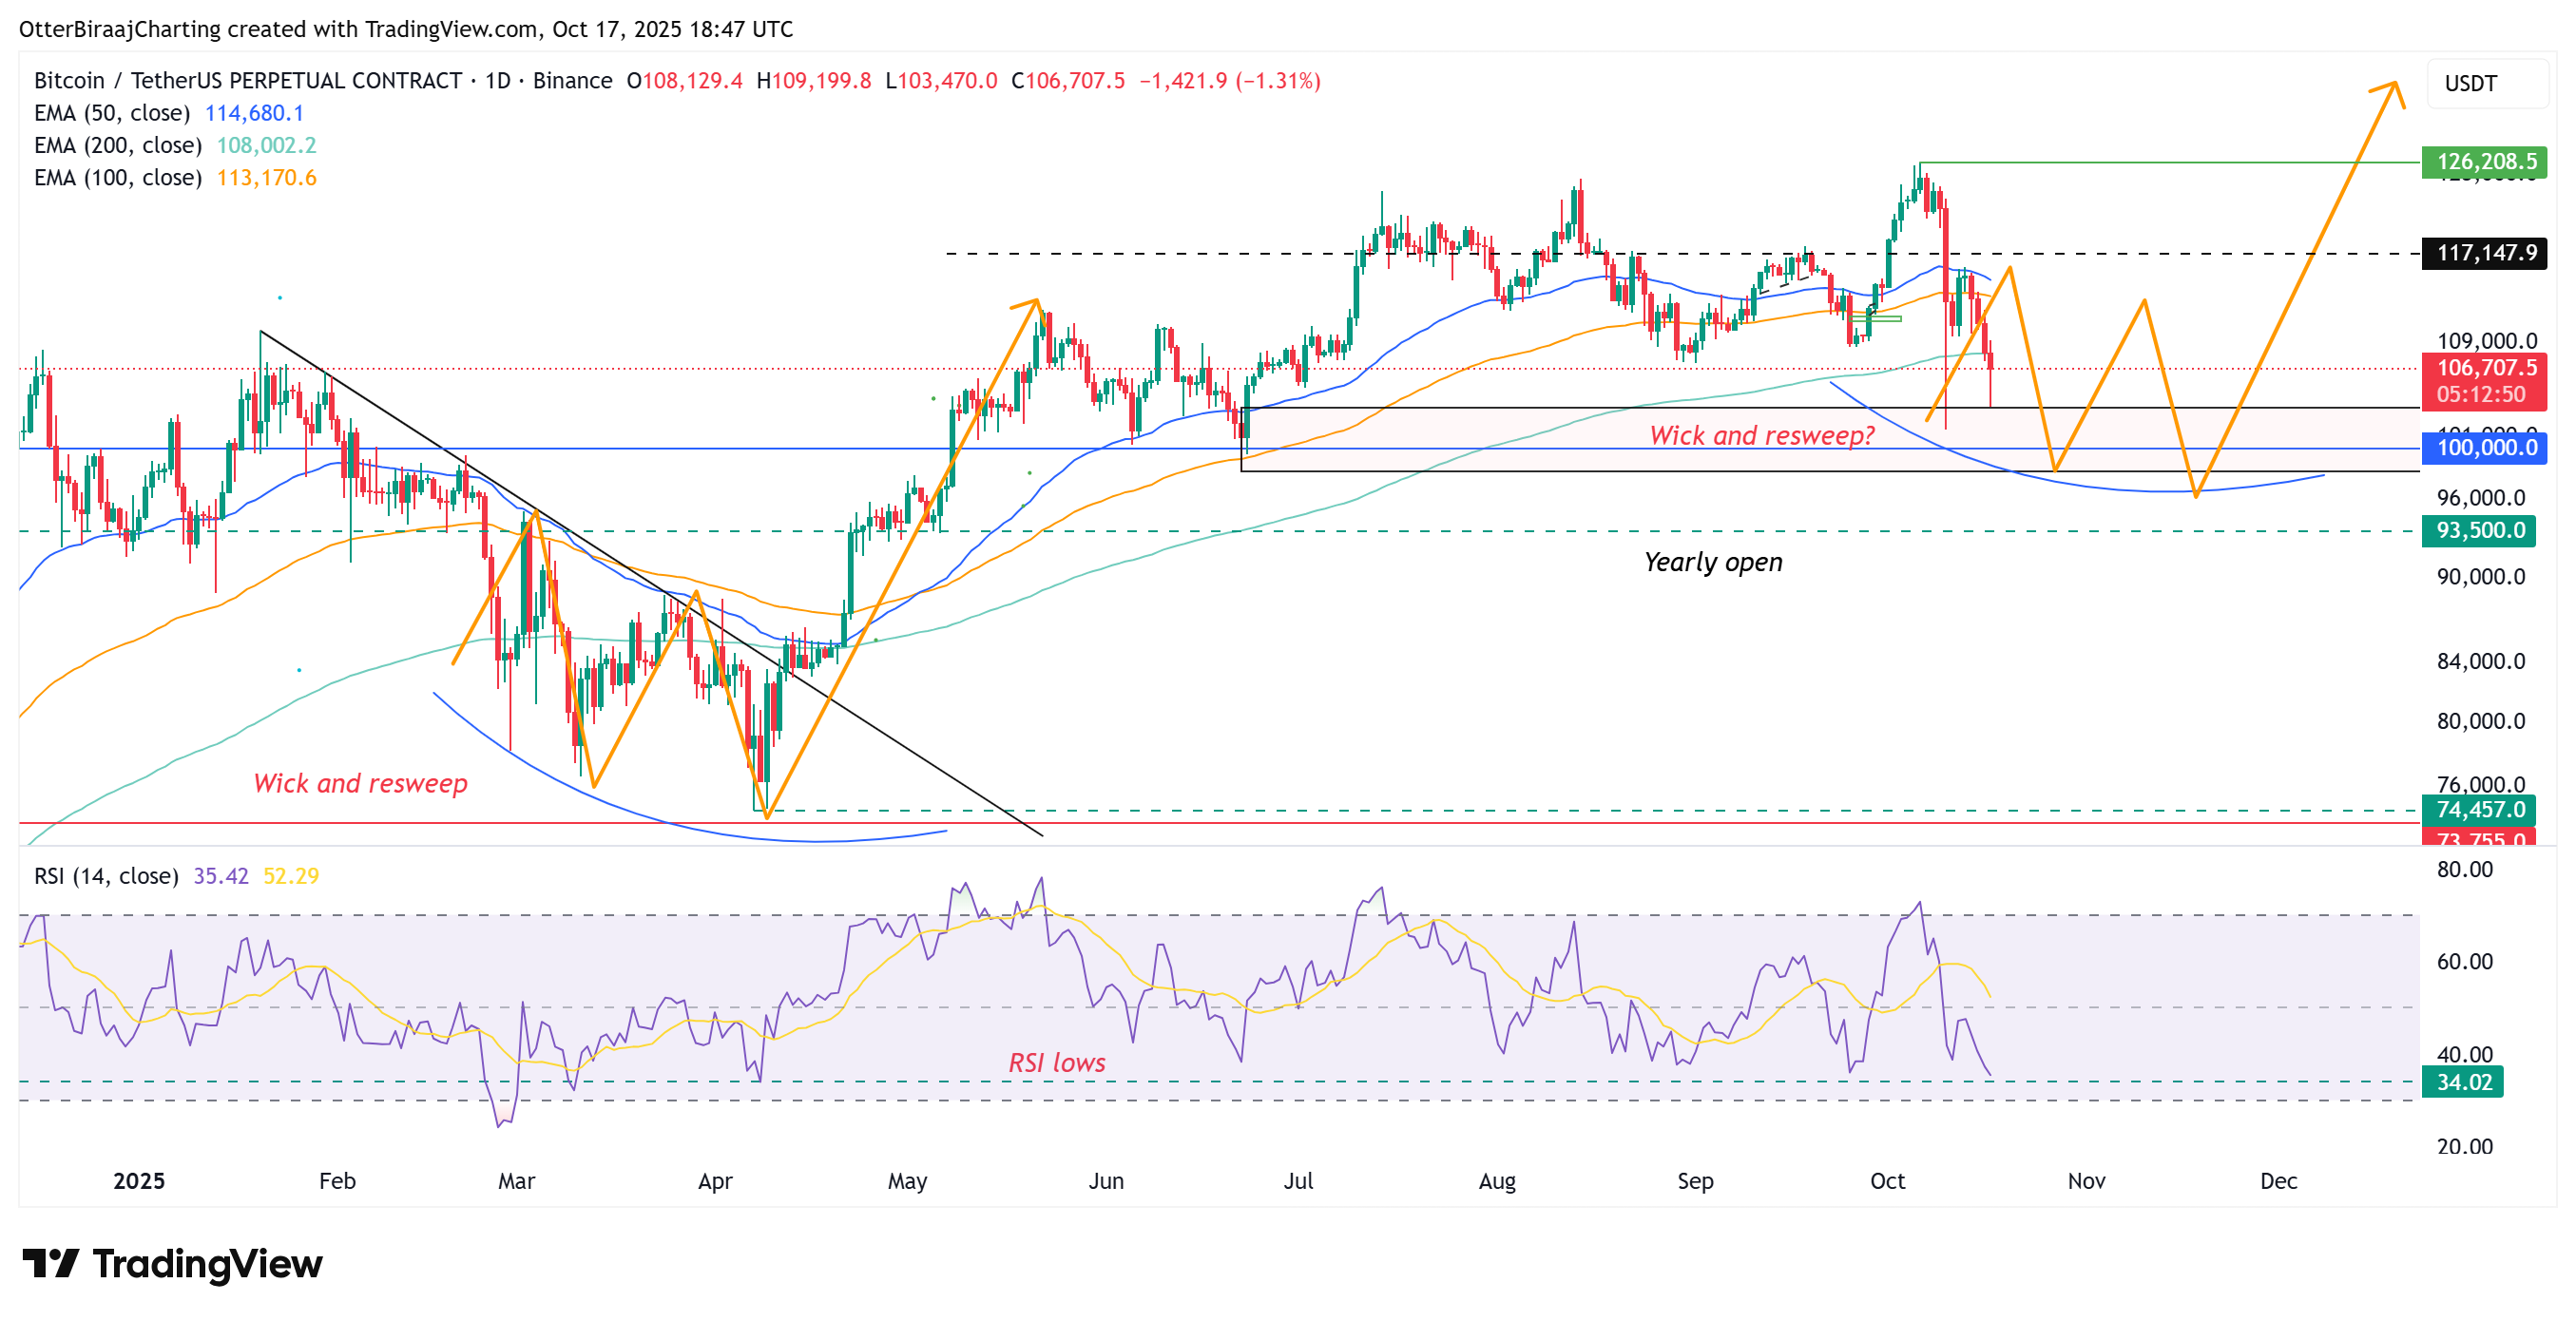 Bitcoin one-day chart. Source: Cointelegraph/TradingView
The Relative Strength Index (RSI) has dropped to its lowest point, aligning with April’s low of 34, marking the phase before BTC commenced its recovery.
A crucial technical indicator to observe is the 200-day exponential moving average (EMA), which BTC has maintained for nearly six months. In previous cycles, this trend has been upheld from October 2024 to March 2024, briefly breaking during consolidation. Currently, this trendline has been intact from April to October 2025, though it may face loss imminently.
If BTC aligns with its prior fractal patterns, it may enter a consolidation phase lasting several weeks, similar to Q1, where recovery time extended to nearly 45-55 days, concluding with a true bottom just by late April. Projections based on this timeframe indicate a potential gradual recovery may only emerge by late November or early December.
Crypto trader Dentoshi reiterated this sentiment, stating:
“$BTC has consistently bottomed around the 3-day 100 EMA this bull run—but it’s taken 45–96 days to do so.”
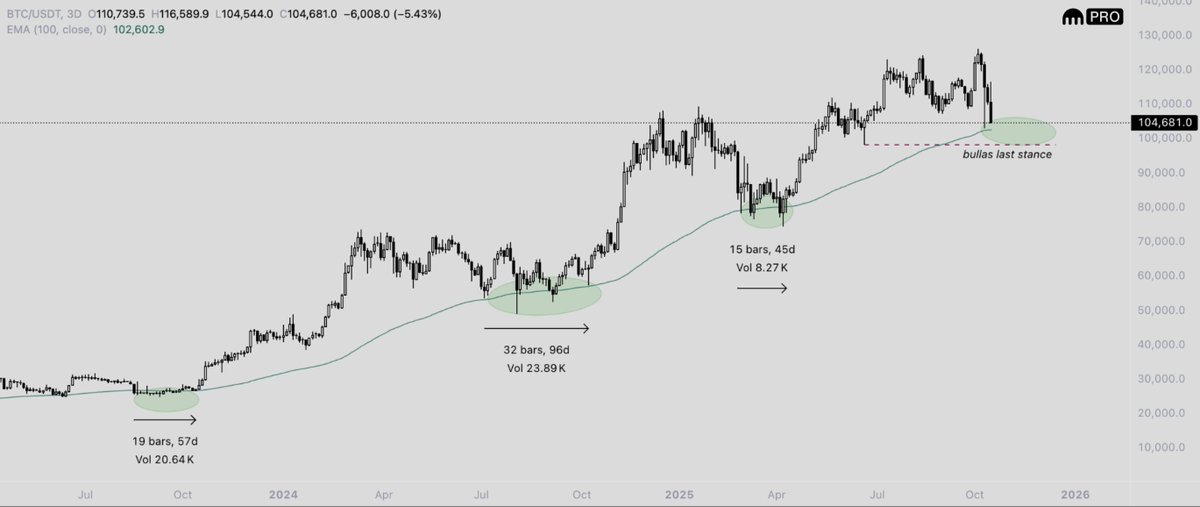 Bitcoin three-day chart analysis. Source: Dentoshi/X
This article does not provide any investment advice or recommendations. All investment and trading activities involve risk, and readers are encouraged to conduct personal research before making any decisions.
