BTC Price Strategy: Bitcoin Must Recapture $114K for Bullish Momentum
A recent analysis suggests Bitcoin should reclaim the $114K level to sustain its bullish trend as price recovers from recent lows.


Bitcoin has bounced back from a key institutional demand area close to $106K, reclaiming important short-term structural levels. While the momentum is cautious, recovering the range between $114K and $116K remains vital for affirming a bullish continuation towards prior all-time highs.
Technical Analysis
The Daily Chart
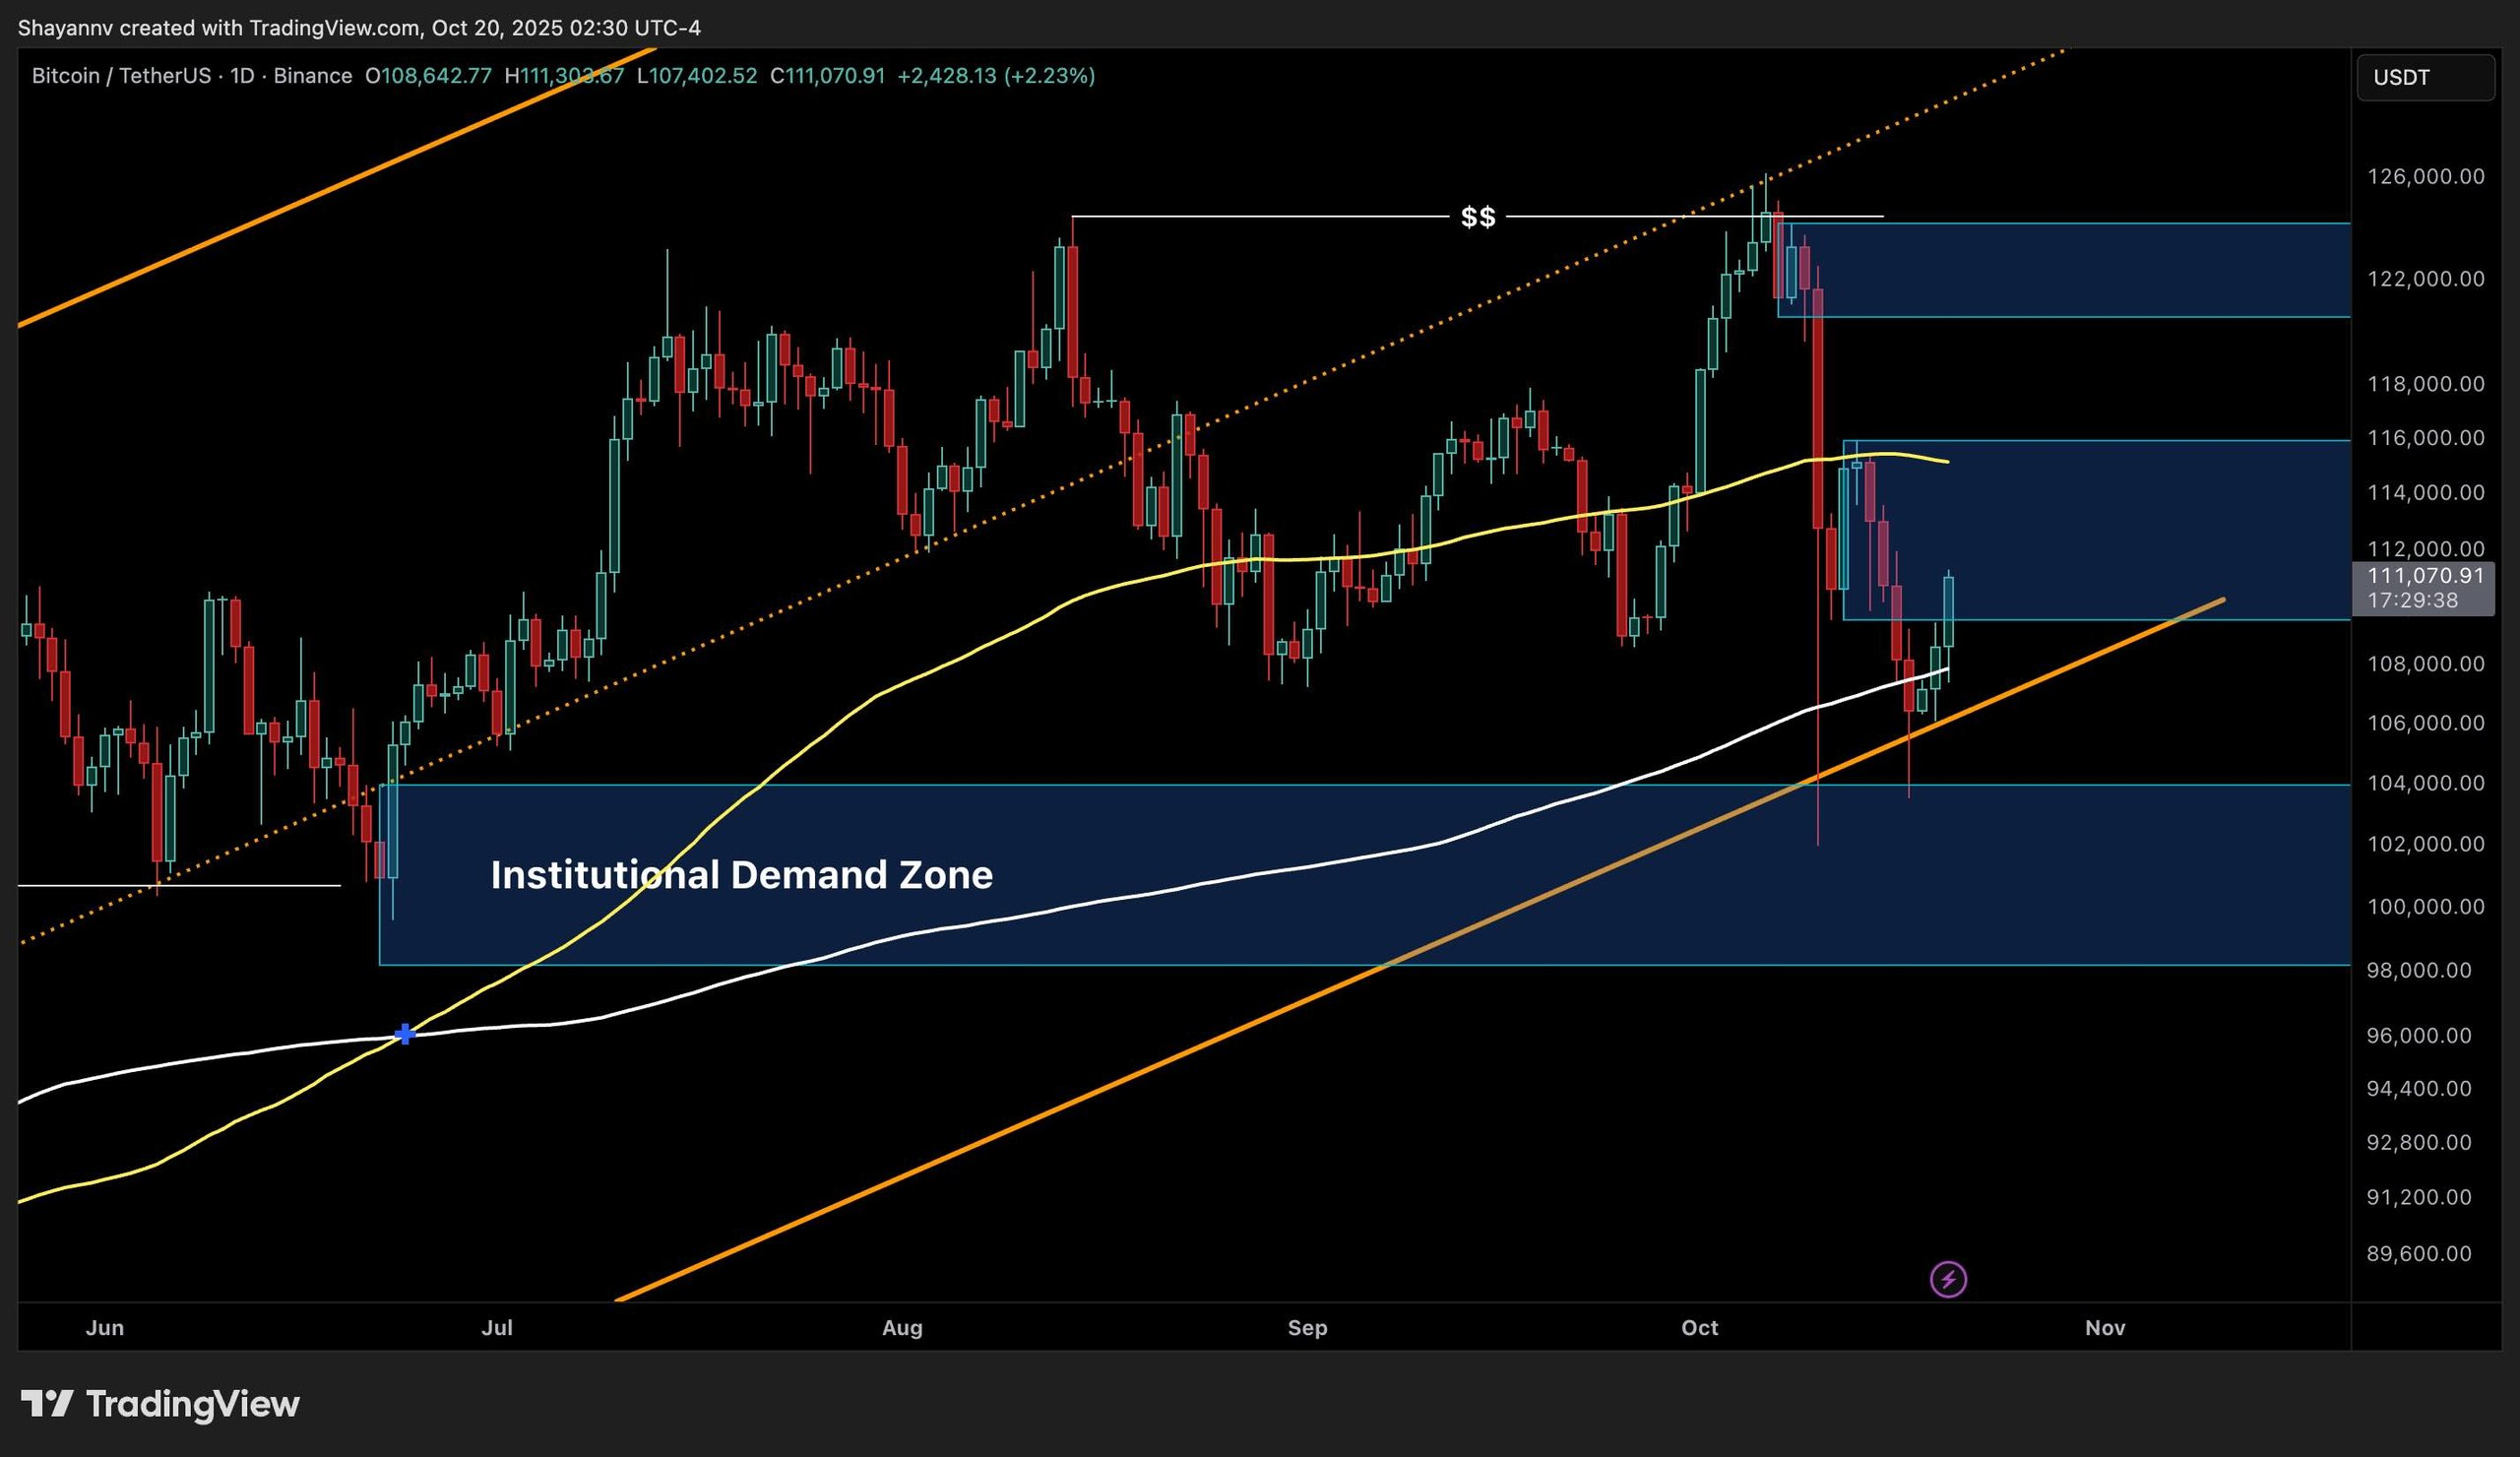
Bitcoin has shown a robust rebound from the institutional demand zone around $102K–$104K, indicating a stronger push aligned with both the 200-day moving average and ascending channel support that has sustained the uptrend since mid-2024.
This recovery exhibits initial signs of resilience; however, the 100-day moving average positioned around $115K serves as immediate resistance, coinciding with a pivotal testing ground for bulls.
Source: TradingView
If Bitcoin can close above $116K, it may pave the way for a reattempt at the $120K–$122K supply zone, followed by the previous $125K all-time high. A failure to breach these moving averages could lead to a revisit of the $102K–$104K demand zone, which remains a significant accumulation region.
The 4-Hour Chart
The 4-hour structure indicates a standard retracement rally, with prices once again establishing higher lows following a strong reaction from the $102K–$104K region. Currently, Bitcoin is stabilizing beneath the Fibonacci retracement levels of $114K–$117K, aligning with historical range bases.
This area represents a crucial decision point for short-term traders. A confirmed breakout above this threshold could signify a shift in momentum towards the $120K–$122K liquidity pocket, whereas a failure to recover could lead to a re-evaluation of the $102K–$104K demand area.
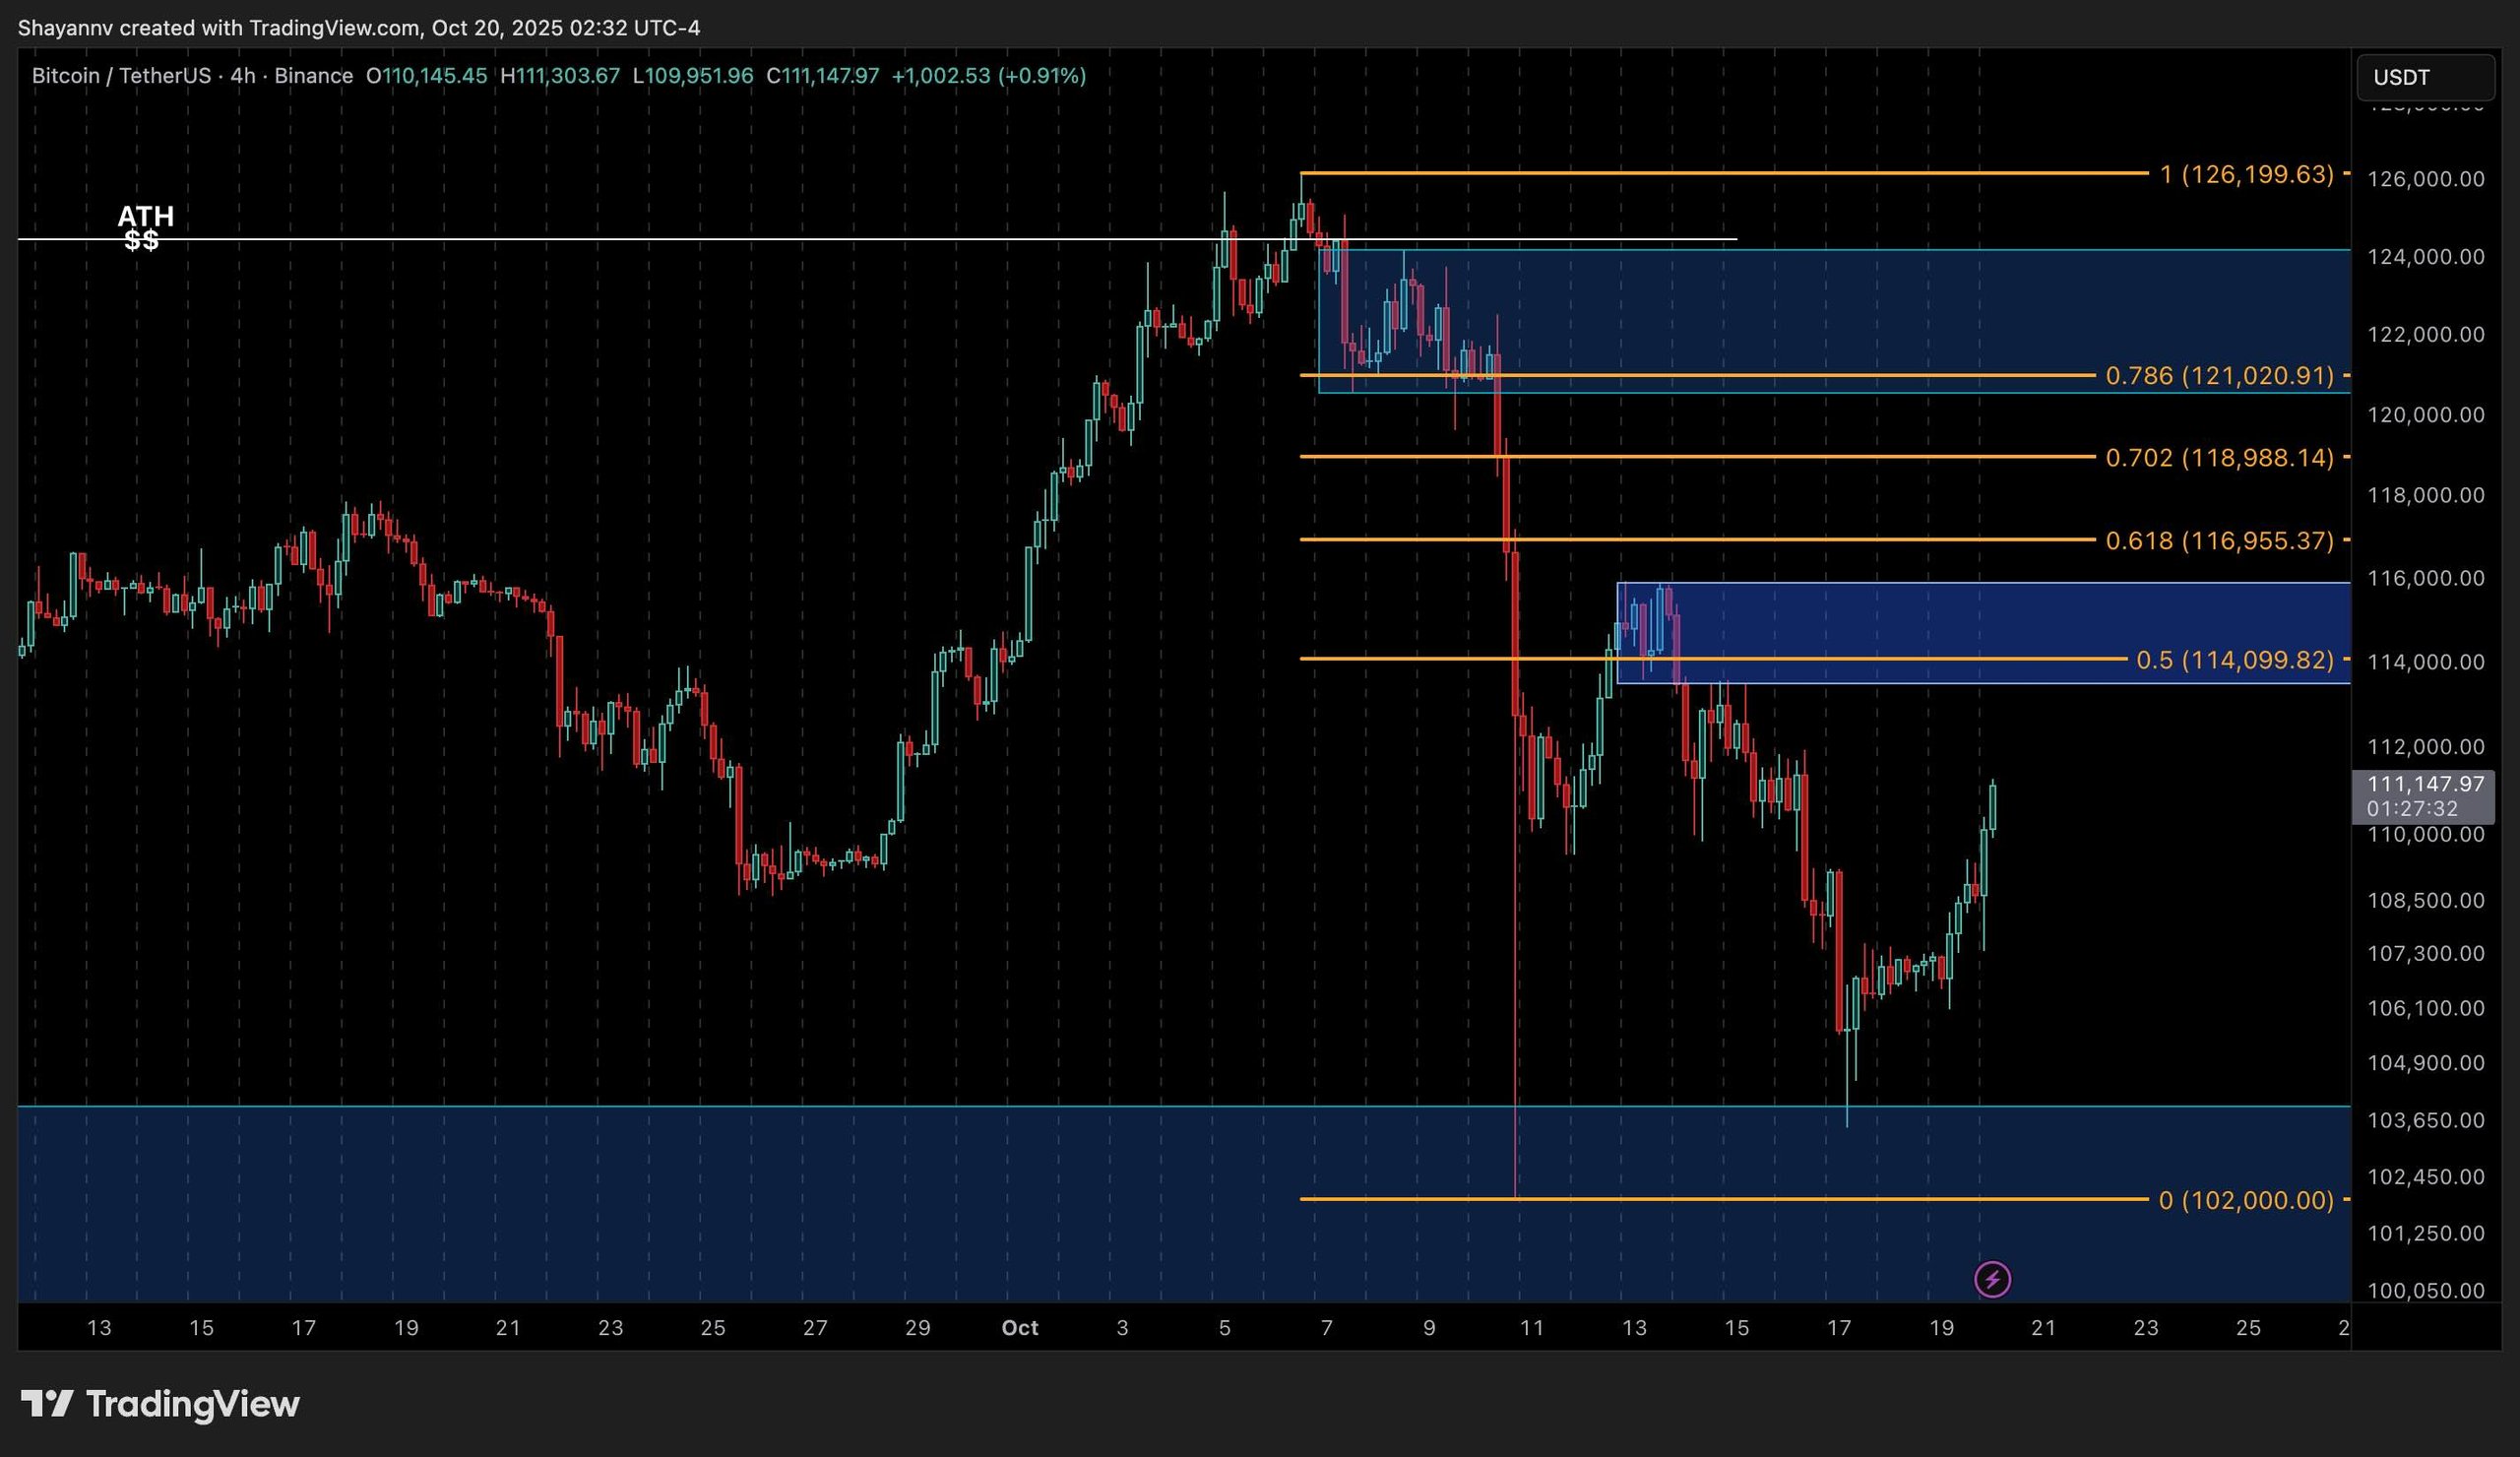 Source: TradingView
On-chain Analysis
The Bitcoin MVRV Ratio, currently at 1.9, sits slightly below its 365-day moving average. Historically, when this ratio dipped beneath the 365-day SMA, it indicated significant buying opportunities and local bottoms, as seen in mid-2021, June 2022, and early 2024.
This consistent trend points towards a re-evaluation phase for the market, where long-term holders typically start accumulating assets. The MVRV Ratio’s position below its long-term average reflects a decrease in speculative activities and a rise in long-term investor confidence, complementing Bitcoin’s technical recovery from the institutional demand area.
If this metric begins to improve, it could signal that the recent sell-off constituted a cyclical bottom, supporting a bullish revival into the fourth quarter.
