Is This the Final Chance for Ethereum? Analysts Predict Surge
Ethereum is breaking key resistance levels, sparking optimism for a potential rally towards $8,000 as 2025 approaches.


Is This the Final Chance for Ethereum? Analysts Predict Surge
Ethereum is breaking key resistance levels, sparking optimism for a potential rally towards $8,000 as 2025 approaches.
Ethereum’s Technical Strength
Ethereum shows bullish technical indicators that might signal a significant price increase. Analysts are examining key patterns and demand levels that historically led to substantial rallies.
Recent Performance
Ethereum is currently trading above critical price zones, with many questioning if this trend will persist as the year ends.
Monthly Breakout Signals Higher Targets
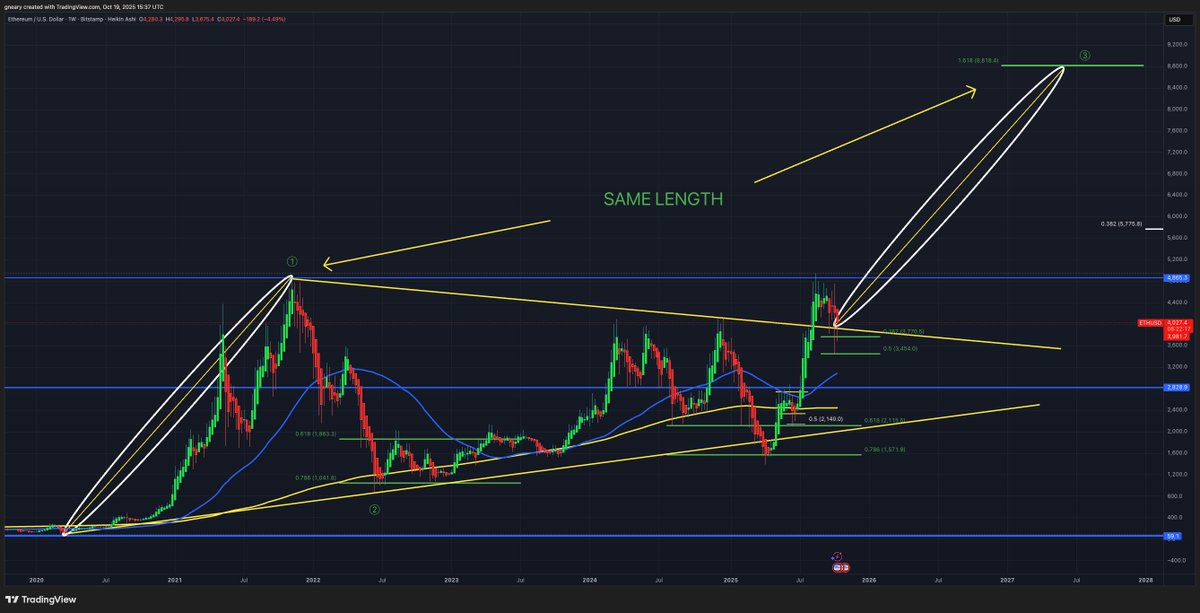
Crypto trader Merlijn The Trader shared a chart indicating Ethereum’s break from a prolonged pennant formation, which follows its rally to around $4,800 in 2021 and extended periods of consolidation. This breakout could signal a fresh wave of buying.
“This is the most explosive setup since 2017,” with targets between $8,000 and $8,500 if the momentum continues, as Ethereum trades at about $4,100, reflecting a 4% increase over the last day.
Comparative Analysis
A recent chart from EtherNasyonaL compared current Ethereum behaviors to prior market cycles. Similar patterns were observed in 2016 and 2020, where ETH was able to retest pivotal demand zones before significant price surges. They cautioned,
People are not bullish enough about $ETH.
In its first two cycles, Ethereum retested a major demand zone before skyrocketing.
Currently, we see the same scenario repeat.
The difference is that many still exit before the climax.
— EᴛʜᴇʀNᴀꜱʏᴏɴᴀL 💹🧲 (@EtherNasyonaL) October 19, 2025
The enduring demand zone has remained intact, confirming a supportive rebound.
Support Stability After Breakout
The Long Investor indicated that Ethereum has recently broken out from an extensive wedge and is now retesting it as support. It has been trading between $3,700 and $3,900 for the past three weeks, needing to maintain this support for a successful rally, mirroring 2020’s breakout pattern with targets upwards of $8,200.
Mixed Momentum Indicators
Daan Crypto Trades noted a test of the 0.382 Fibonacci level and daily 200 EMA. He expressed,
“I want to see it back above previous cycle highs near $4.1K to regain bullish momentum.”
However, Ali Martinez cautioned against complacency by citing a warning from the MVRV Momentum indicator, which previously signaled a drop from $3,300 to $1,400. This same pattern has recently repeated, suggesting possible short-term declines ahead.
