


Market Recovery Insights: Bitcoin Surges After Recent Sell-Off
Bitcoin staged a significant rebound to $111,705 as markets show signs of recovery following the previous drastic sell-off. However, there are indications that profit-taking by sellers will persist at every increase in price.
Key Highlights:
- Bitcoin and most major altcoins demonstrated resilience, bouncing back off key support levels, highlighting strong demand at lower prices.
- Sustaining this upward trend may be challenging, as sellers are likely to capitalize on any rallies.
Bitcoin (BTC) showed a robust recovery on a Monday, surpassing the $111,000 mark, partly fueled by U.S. President Donald Trump confirming a summit with Chinese President Xi Jinping scheduled for October 31. This announcement has raised hopes for a potential trade agreement between the two economic giants.
Despite recent downward movements, many institutional investors remain optimistic about BTC. According to Coinbase’s institutional investor survey involving 124 participants, 67% remain bullish on BTC for the next three to six months, whereas 45% believe that the market is in the late stages of a bull run.

In addition to Bitcoin, analysts express a cautious optimism about certain altcoins. John Bollinger, a notable technical analyst, indicated on X that Ether (ETH) and Solana (SOL) are beginning to form what’s known as W bottoms in Bollinger Band analysis, while BTC has not yet aligned with this pattern. He mentioned it’s “time to pay attention soon.”
Will the recovery hold for BTC and altcoins, or will resurgent selling pressure emerge?
Let’s delve into charts of the top 10 cryptocurrencies for insights.
S&P 500 Index Price Forecast
The S&P 500 Index (SPX) saw buyers successfully halt its pullback at the 50-day simple moving average (SMA) (6,570), indicating demand at dips.
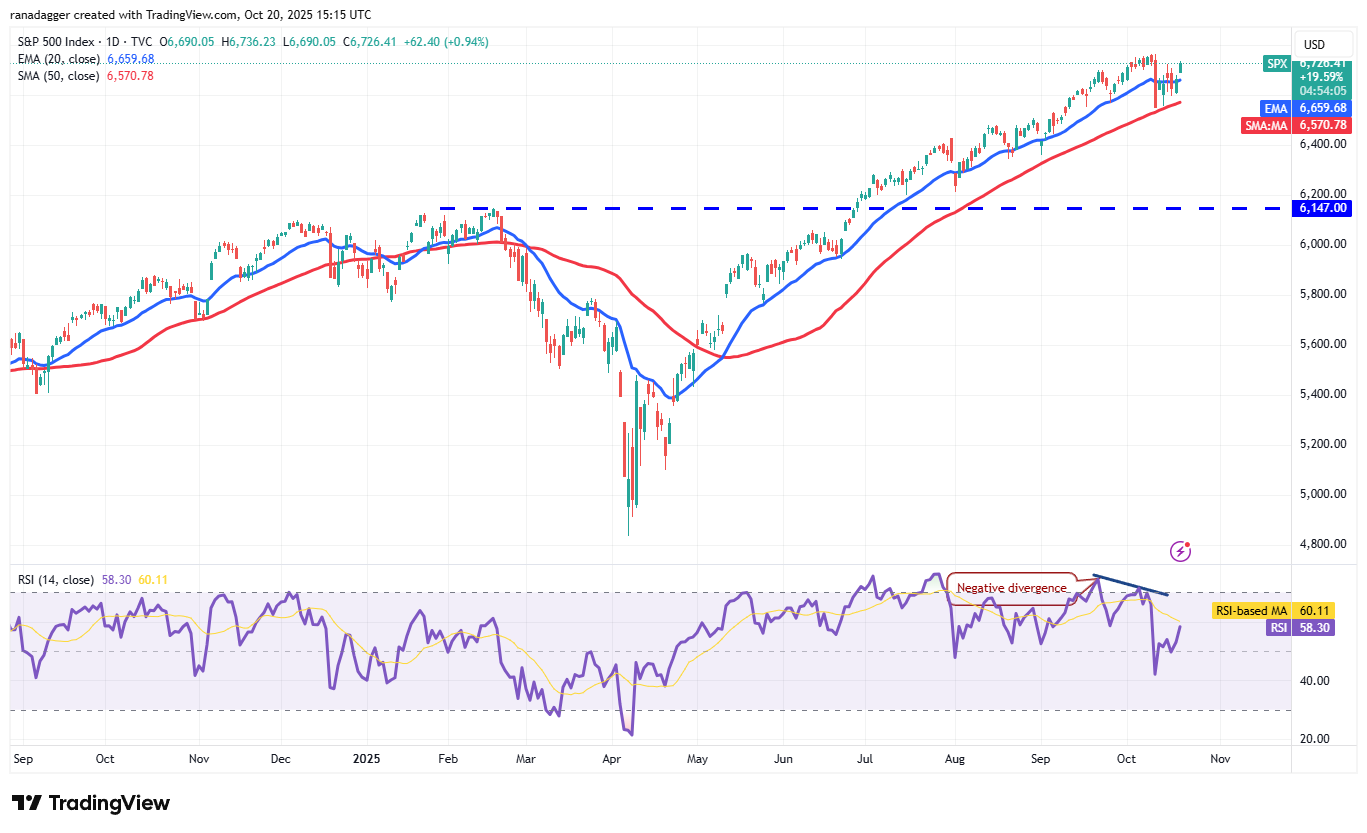 SPX daily chart. Source: Cointelegraph/TradingView
The bulls aim to break past the all-time high of 6,764, which would pave the way for a continuation of the bullish trend. However, if prices decline sharply below the 50-day SMA, a deeper correction could drive the index down to 6,350, and possibly lower to 6,200.
US Dollar Index Prediction
The US Dollar Index (DXY) is currently experiencing a tense standoff between buyers and sellers at its downtrend line.
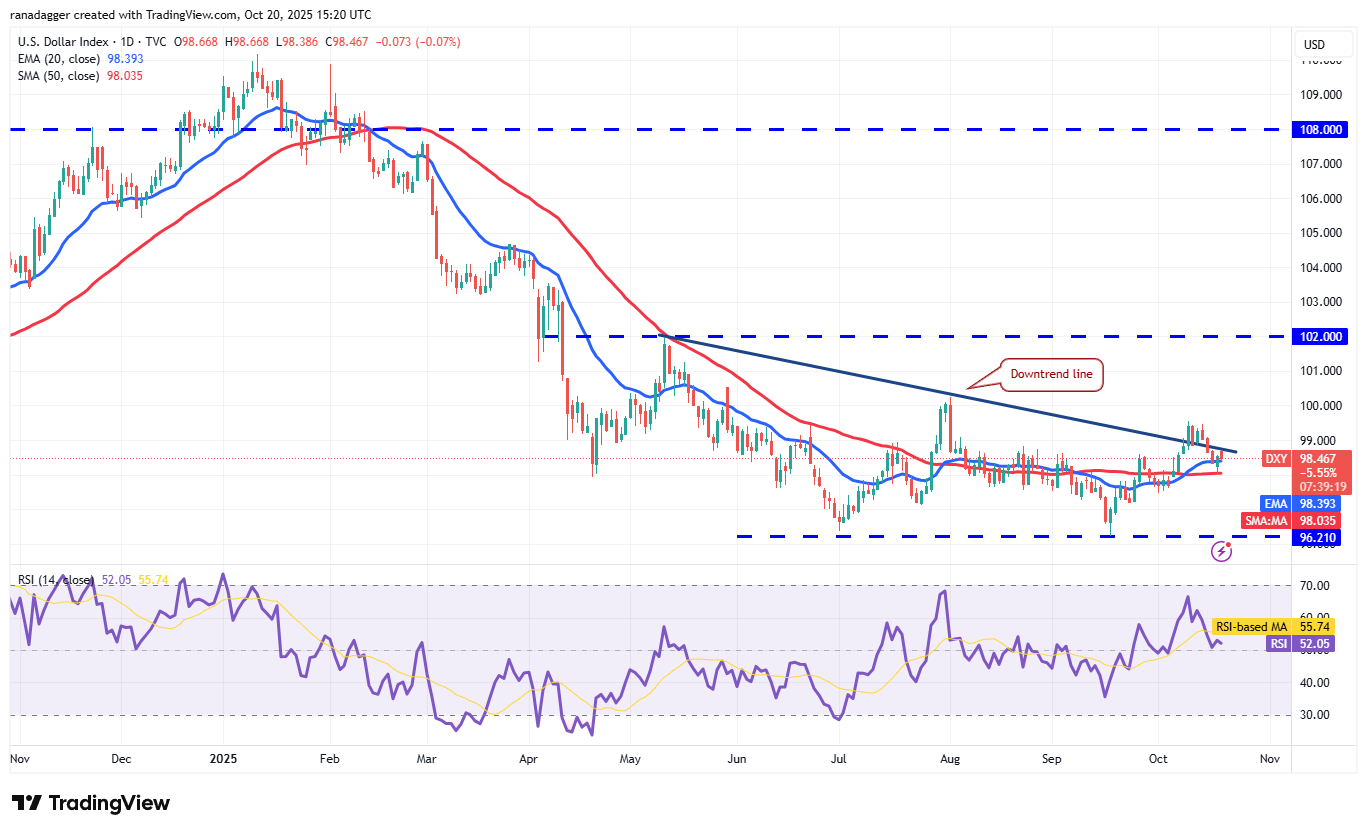 DXY daily chart. Source: Cointelegraph/TradingView
After sellers managed to drive prices below this line, buyers have been attempting to reclaim upward momentum, aiming for the 100.50 level. A decline below 50-day SMA could indicate rejection of the downtrend line, with potential drops to 97.46 and 97.19 predicted.
Bitcoin Price Forecast
The failure of bears to keep Bitcoin below the $107,000 stance sparked significant buying activity.
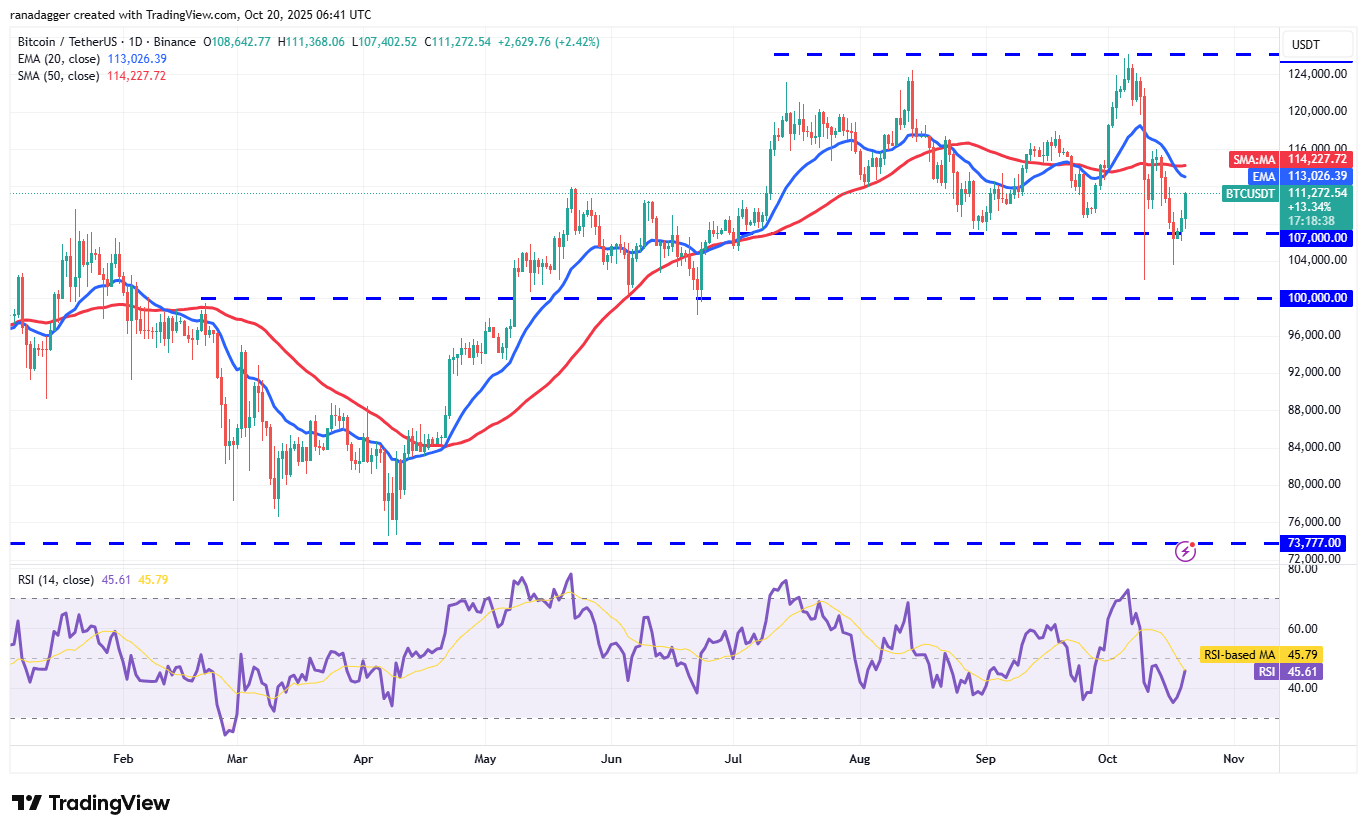 BTC/USDT daily chart. Source: Cointelegraph/
Should buyers breach the moving averages, the correction may conclude, and the BTC/USDT could surge towards an all-time high of $126,199. Conversely, if sellers manage to drag prices back below $107,000, the risk increases for a breakdown beneath the $100,000 support.
Other Altcoin Analyses
Ether (ETH) is trying to maintain its position within a descending channel after a bounce off its support line.
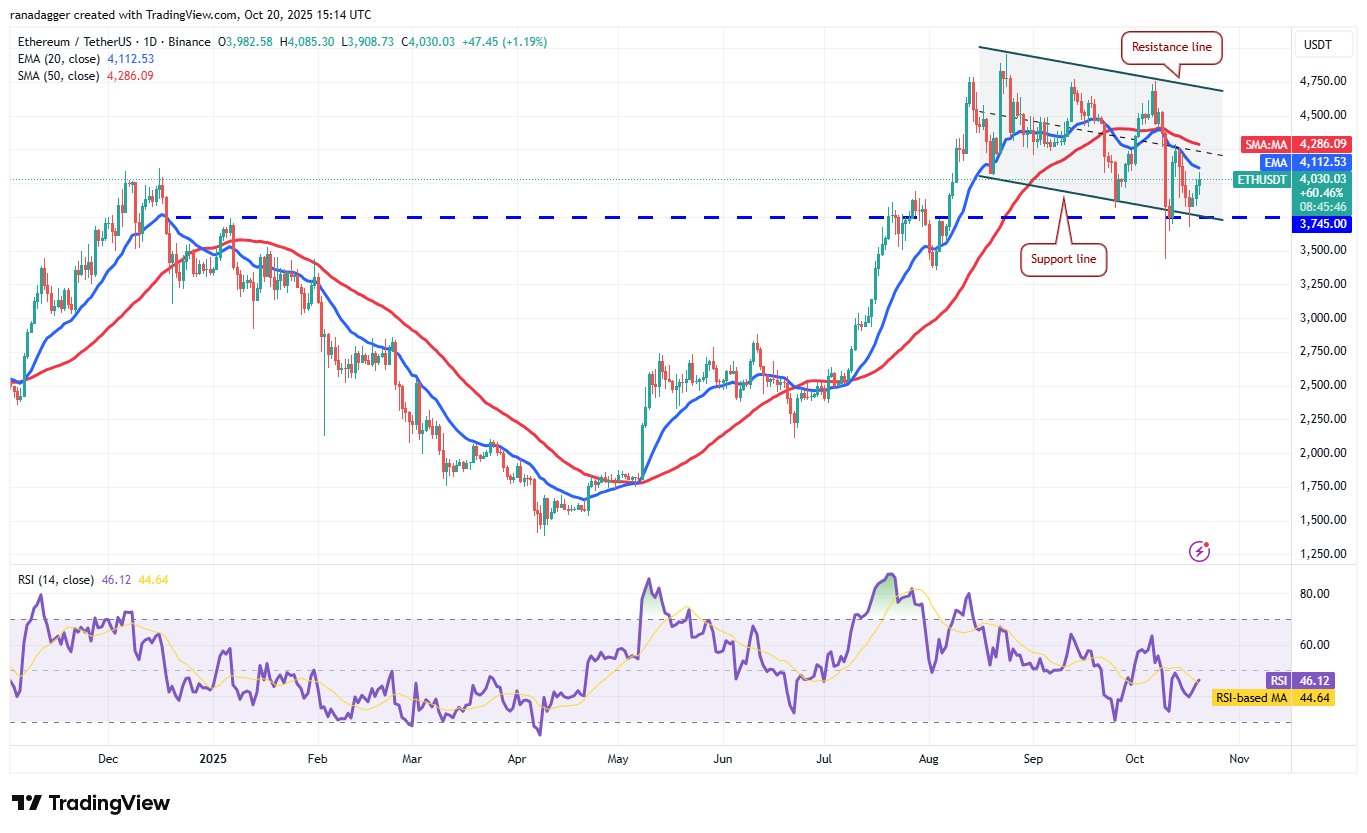 ETH/USDT daily chart. Source: Cointelegraph/TradingView
Possible resistance is anticipated at the moving averages. If bulls prevail, the ETH price could rise towards resistance at $4,957.
In summary, the overall sentiment in the cryptocurrency market appears to be one of cautious optimism, with key support levels holding strong amid investor interest.
