
Bitcoin's Key Support Levels Impacting Price Stability
BTC may face a significant price drop if critical support levels are breached, suggesting a potential fall to $88,000.


Key Insights:
- The formation of a bear flag on the daily Bitcoin chart implies a potential drop in Bitcoin’s price down to $88,000.
- Traders have indicated that if vital support levels fail, the BTC price could even plummet to $97,500.
Bitcoin’s price has encountered a significant drop of 13% from its all-time peak of $126,000 amid concerns regarding support levels.
Bear Flag Targets Bitcoin at $88,000
The recent formation of a bear flag pattern signifies potential bearish continuation for Bitcoin, especially following a notable downward move.
As mentioned in a detailed analysis, the bear flag appeared after Bitcoin reached a low of about $103,530 on October 11. This ongoing consolidation period has seen the price persistently testing the support level situated at $107,500. A daily close under this threshold would confirm the bear flag, laying the groundwork for a target price around $88,100. This scenario would reflect total losses of around 19%.
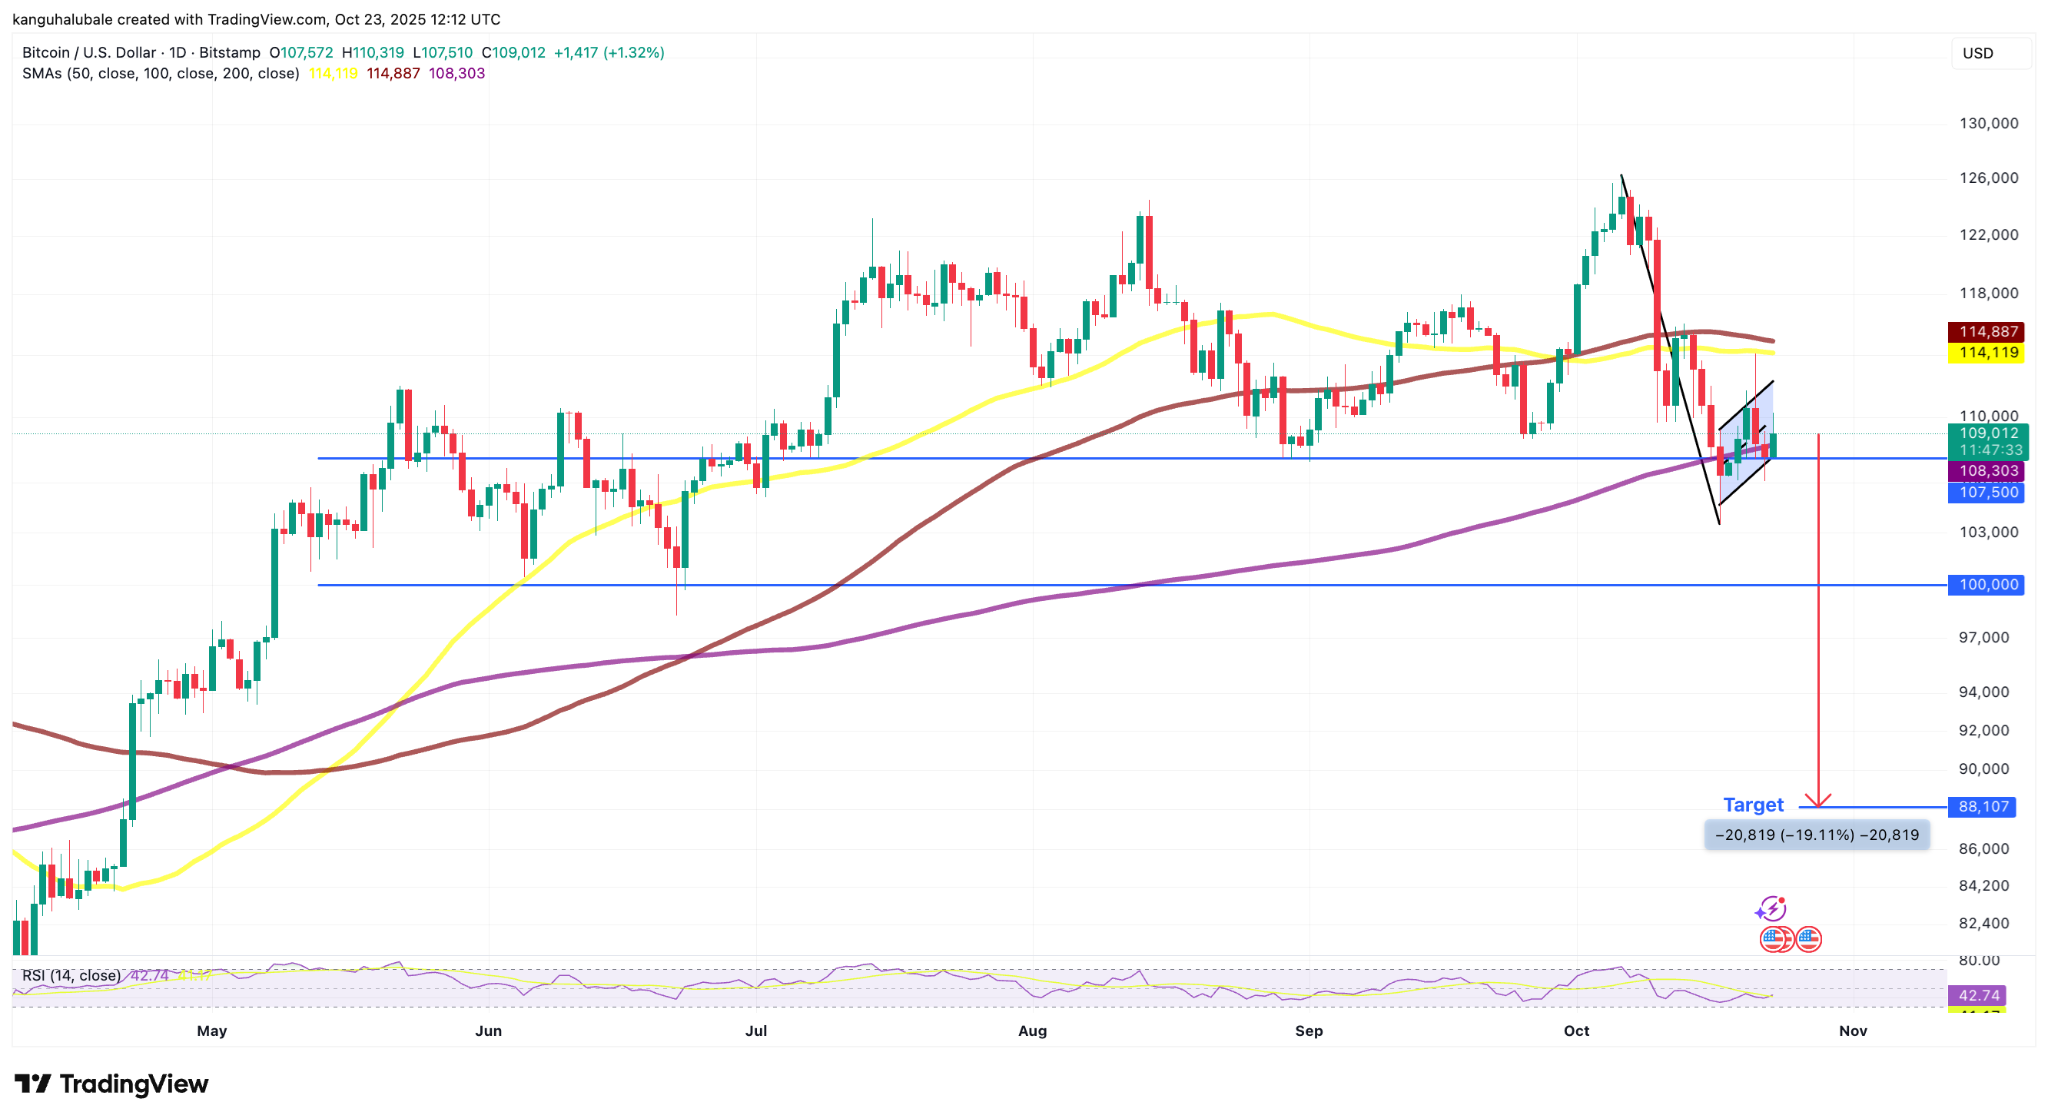 BTC/USD daily chart
Source: Cointelegraph/TradingView
Momentum indicators, particularly the relative strength index (RSI), remain supportive with the RSI currently at 42, which suggests a prevailing bearish trend.
Analysts also project that a similar bearish pattern on the four-hour chart could indicate a further drop to approximately $98,000. This level will be crucial for observing a potential short-term reversal.
Key Price Levels to Monitor
Data sources confirm the BTC/USD pair faced a 13.6% decline from its highest recorded value. Such drops are often indicators of an impending mid-term bearish phase, as weaker investors might begin to sell off their holdings, according to insights from Glassnode.
For Bitcoin to stabilize, it needs to maintain prices above the 0.85 quantile rule priced at $108,600 to prevent any cascading sell-offs. Glassnode’s findings indicate that historical data linking failure to hold above this threshold often presages more considerable corrections, potentially sinking to levels near $97.5K.
“Historical patterns suggest that failure to retain this threshold indicates structural market weakness, often leading to deeper corrections towards the 0.75 quantile.”
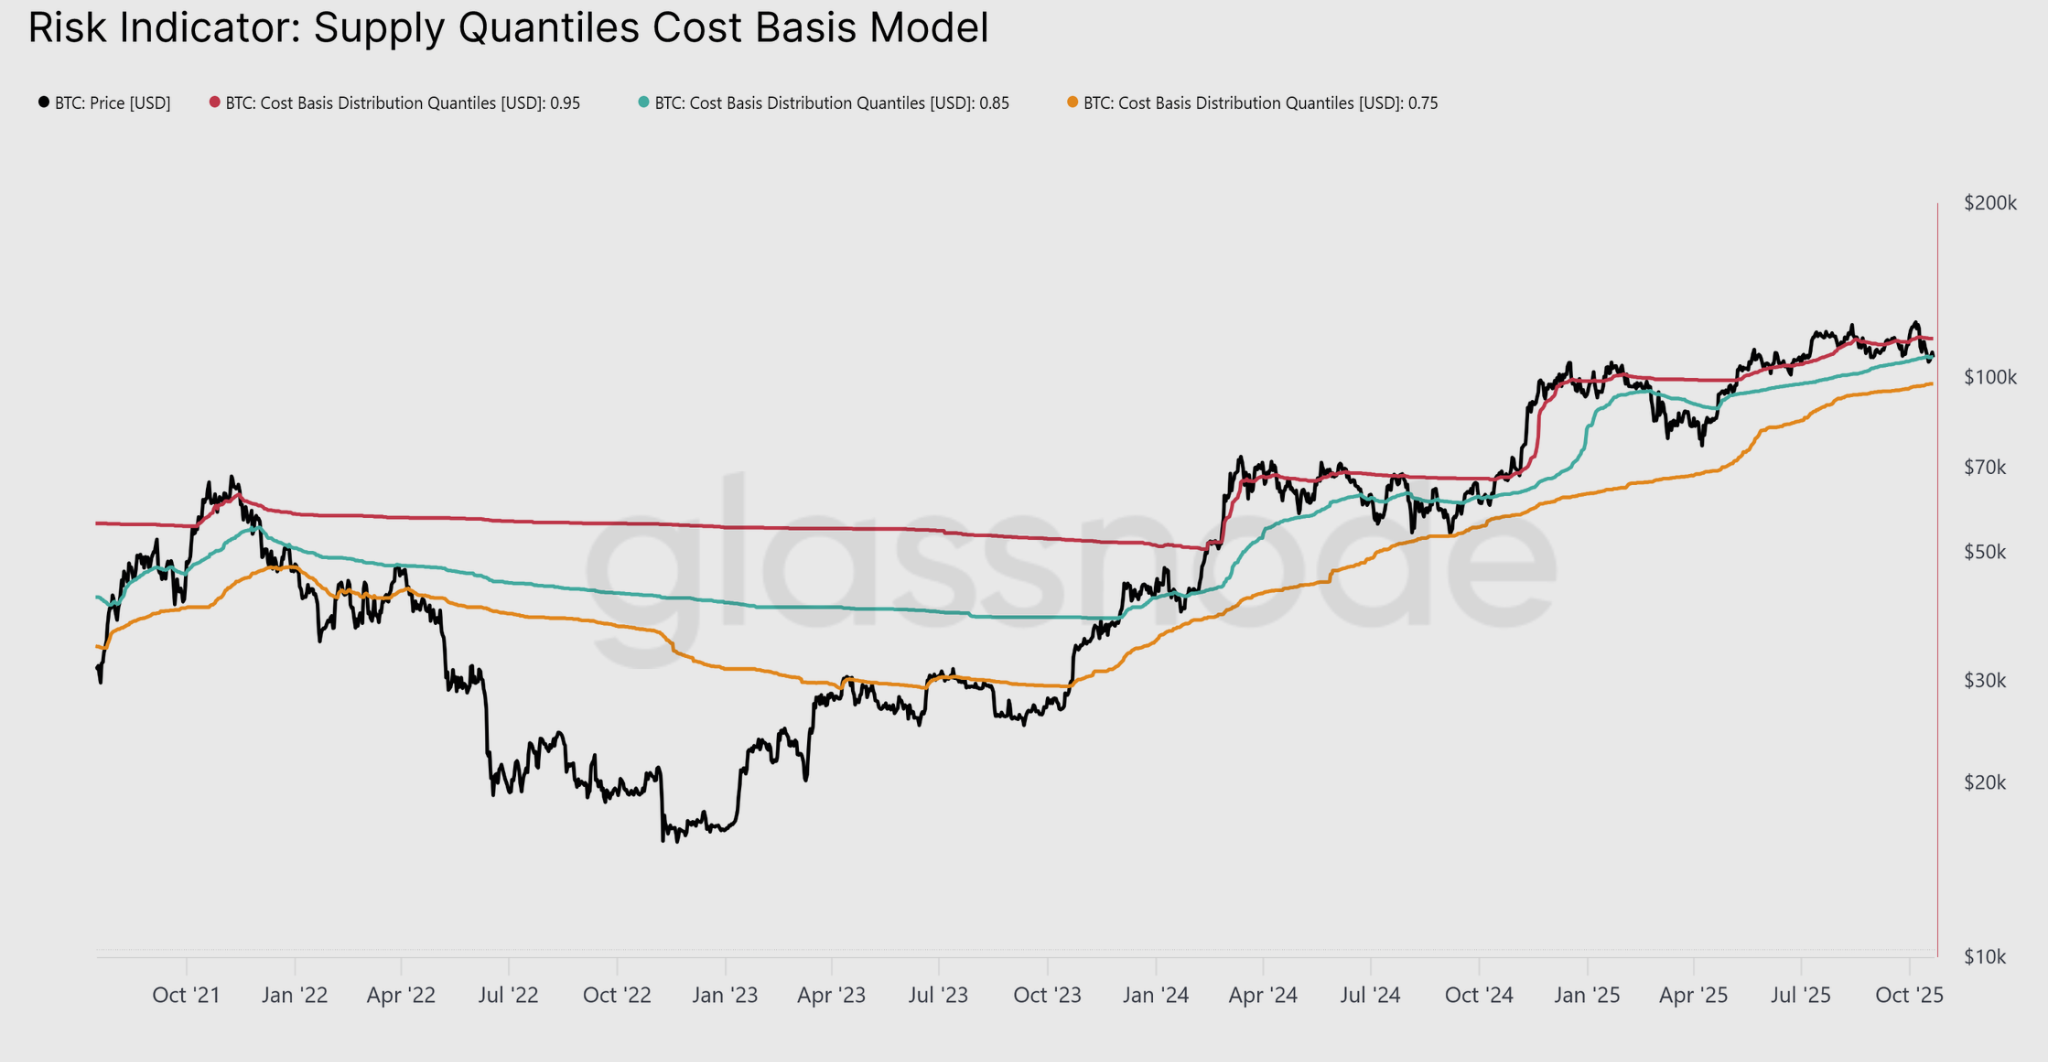 Bitcoin’s risk indicator
Source: Glassnode
Analyst Daan Crypto Trades emphasizes that maintaining the $111,000 level is critical moving forward. If Bitcoin can consistently stay above this, it opens the door for potential upward trends.
“The crucial support at $107K held amidst market volatility, thus maintaining its significance in upcoming trends.”
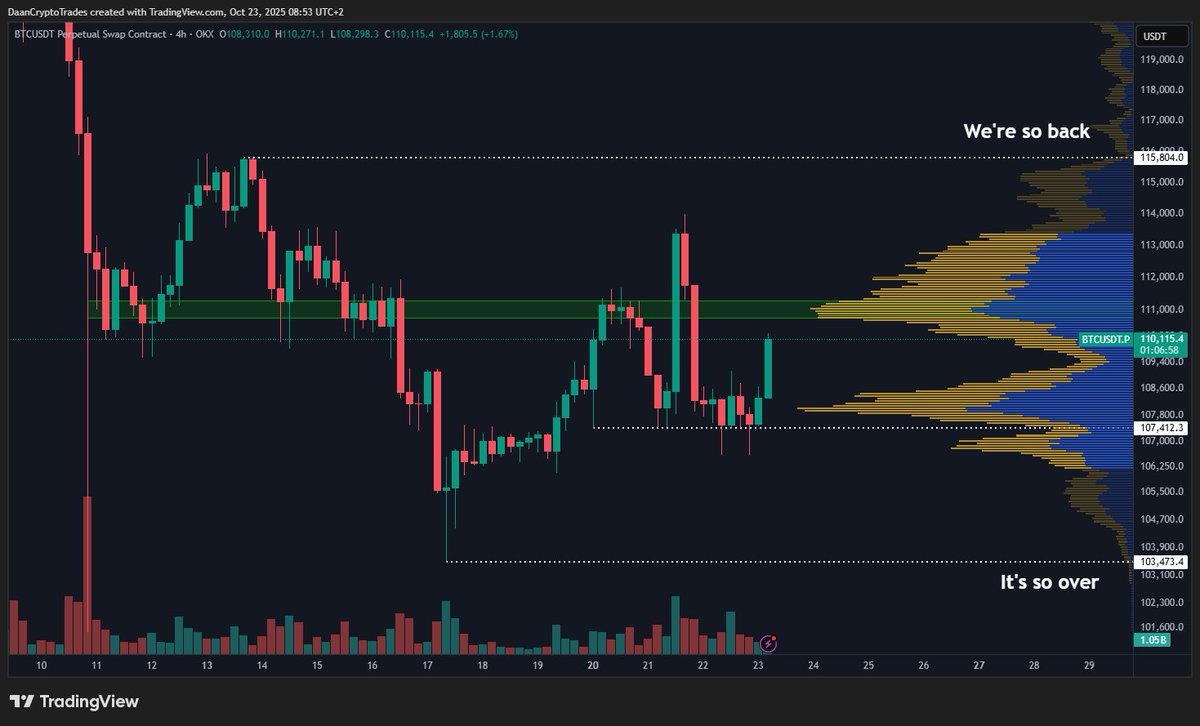 BTC/USD four-hour chart
Source: Daan Crypto Trades
Cointelegraph notes that a decisive daily close below $107,000 could potentially lead Bitcoin down to the psychological barrier of $100,000 or even lower.
This article does not offer investment advice. All trading maneuvers involve risks, and readers should proceed with caution, conducting their analysis prior to any financial decisions.
