


Key Points:
- Bitcoin’s price showed significant volatility due to a lower-than-expected CPI report.
- Market optimism rises as the Federal Reserve is expected to continue interest-rate cuts into 2026.
- Bitcoin faced resistance at $112,000 while establishing key support levels.
Bitcoin ($BTC) fluctuated on Friday following the release of US inflation data, which propelled stocks to new all-time highs.
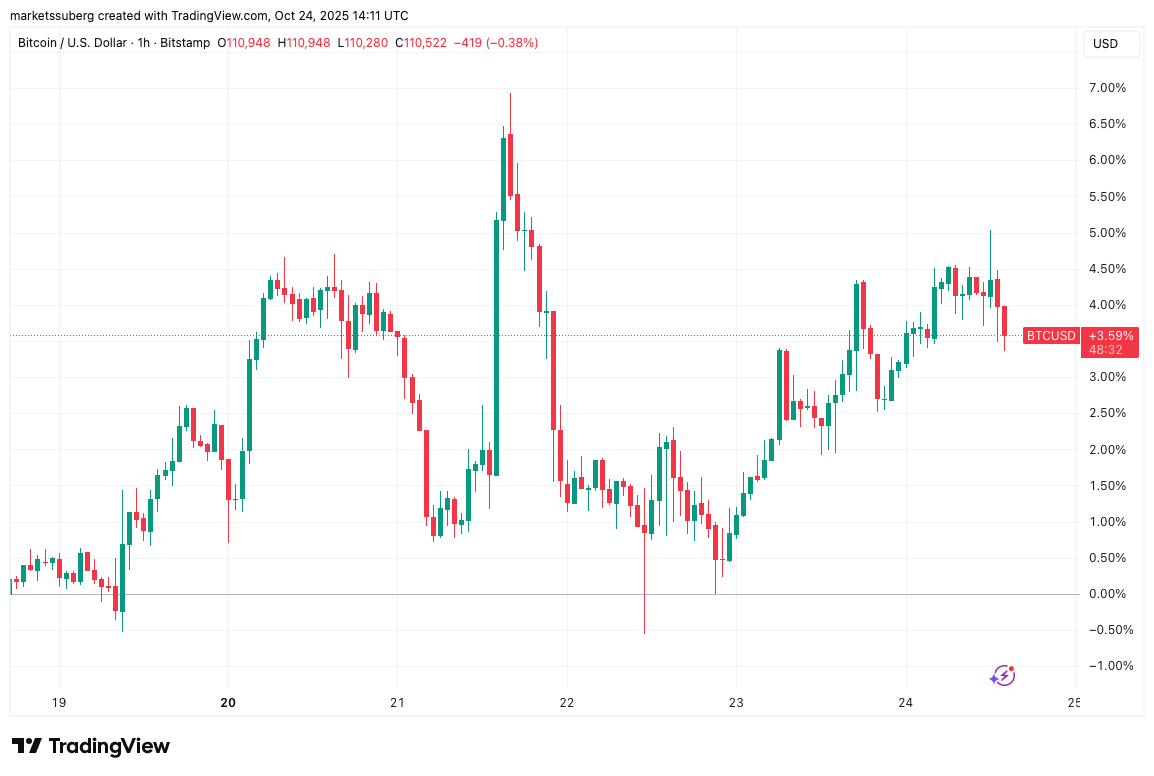 BTC/USD one-hour chart. Source: Cointelegraph/TradingView
CPI Data Fuels New Highs for US Stocks
According to data from Cointelegraph Markets Pro, Bitcoin prices reached up to $112,000 before they corrected at the start of Wall Street’s trading. The September Consumer Price Index (CPI) dropped below expectations across all metrics, providing a significant momentum for crypto and risk assets.
Both the CPI and core CPI showed a decrease of 0.1%, hovering around 3% as stated in an official release from the US Bureau of Labor Statistics (BLS).
Reacting to this data, The Kobeissi Letter remarked that this can create conditions for another Fed rate cut next week.
“This report was published as a ‘rare exception’ during the US government shutdown,” they pointed out, as the S&P 500 achieved record heights.
The CME Group’s FedWatch Tool, which forecasts market expectations on interest rate adjustments by the Federal Reserve, largely indicated a favored 0.25% cut scheduled for October 29.
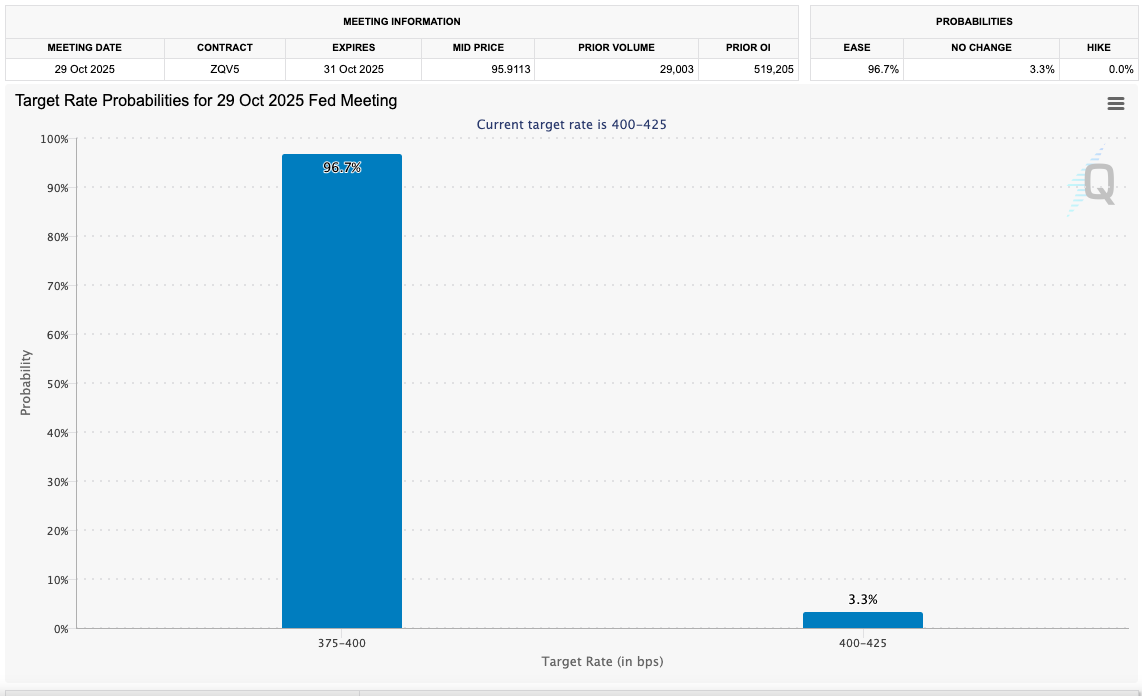 Fed target rate probabilities for October FOMC meeting (screenshot). Source: CME Group
Bitcoin’s Price Faces Challenges Despite Positive CPI Information
Despite the positive CPI announcement, Bitcoin struggled under selling pressure during the US market’s opening.
Related: Worst Uptober ever? Bitcoin price risks first ‘red’ October in years
Traders remained cautious, with commentator Exitpump highlighting a lack of support below the current price level.
$BTC thin bid side on perps orderbook BTW, can dump quickly.
Image link — exitpump (@exitpumpBTC) October 24, 2025
Trader Diego White analyzed the market’s order-book conditions as “heavy,” pointing to new bid levels forming around $110,000, according to data from CoinGlass.
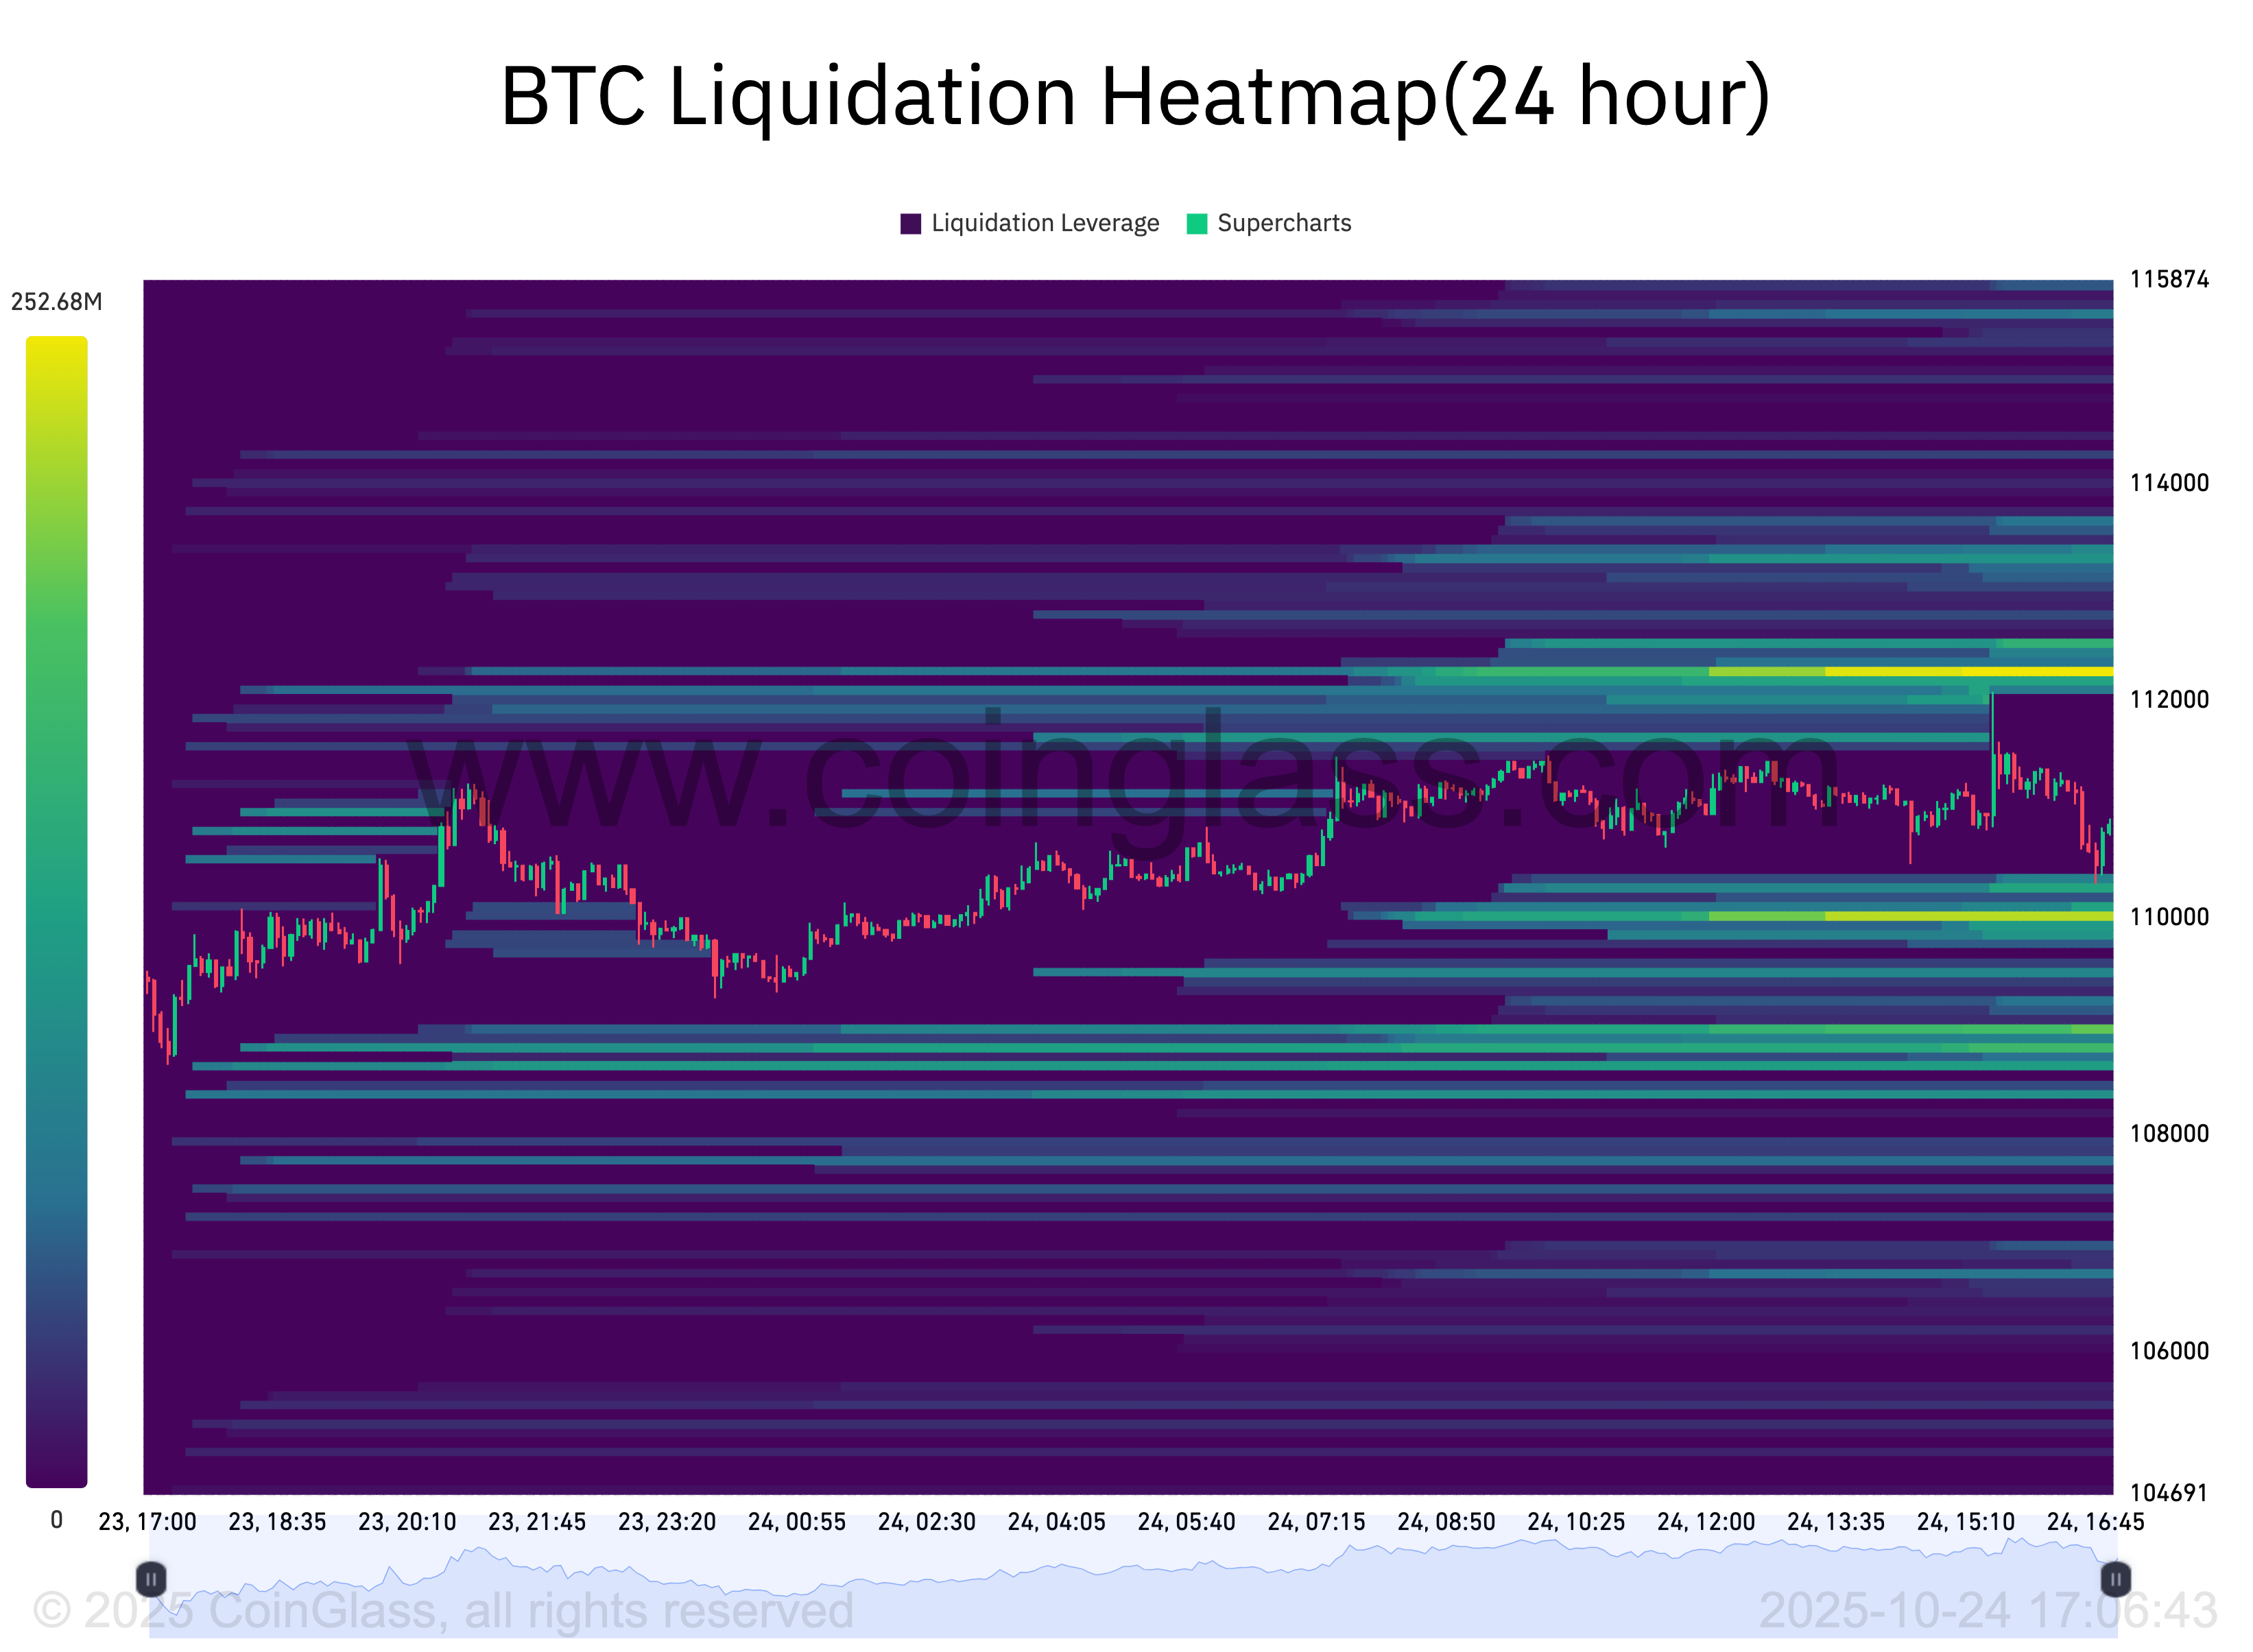 BTC liquidation heatmap. Source: CoinGlass
Additionally, Caleb Franzen from Cubic Analytics indicated three critical exponential moving averages (EMAs) that must be upheld as support.
“$BTC is currently rebounding on the 200-day EMA, which is essential. It needs to break and close above the 21/55, which acted as resistance during the prior retest this week,” he explained.
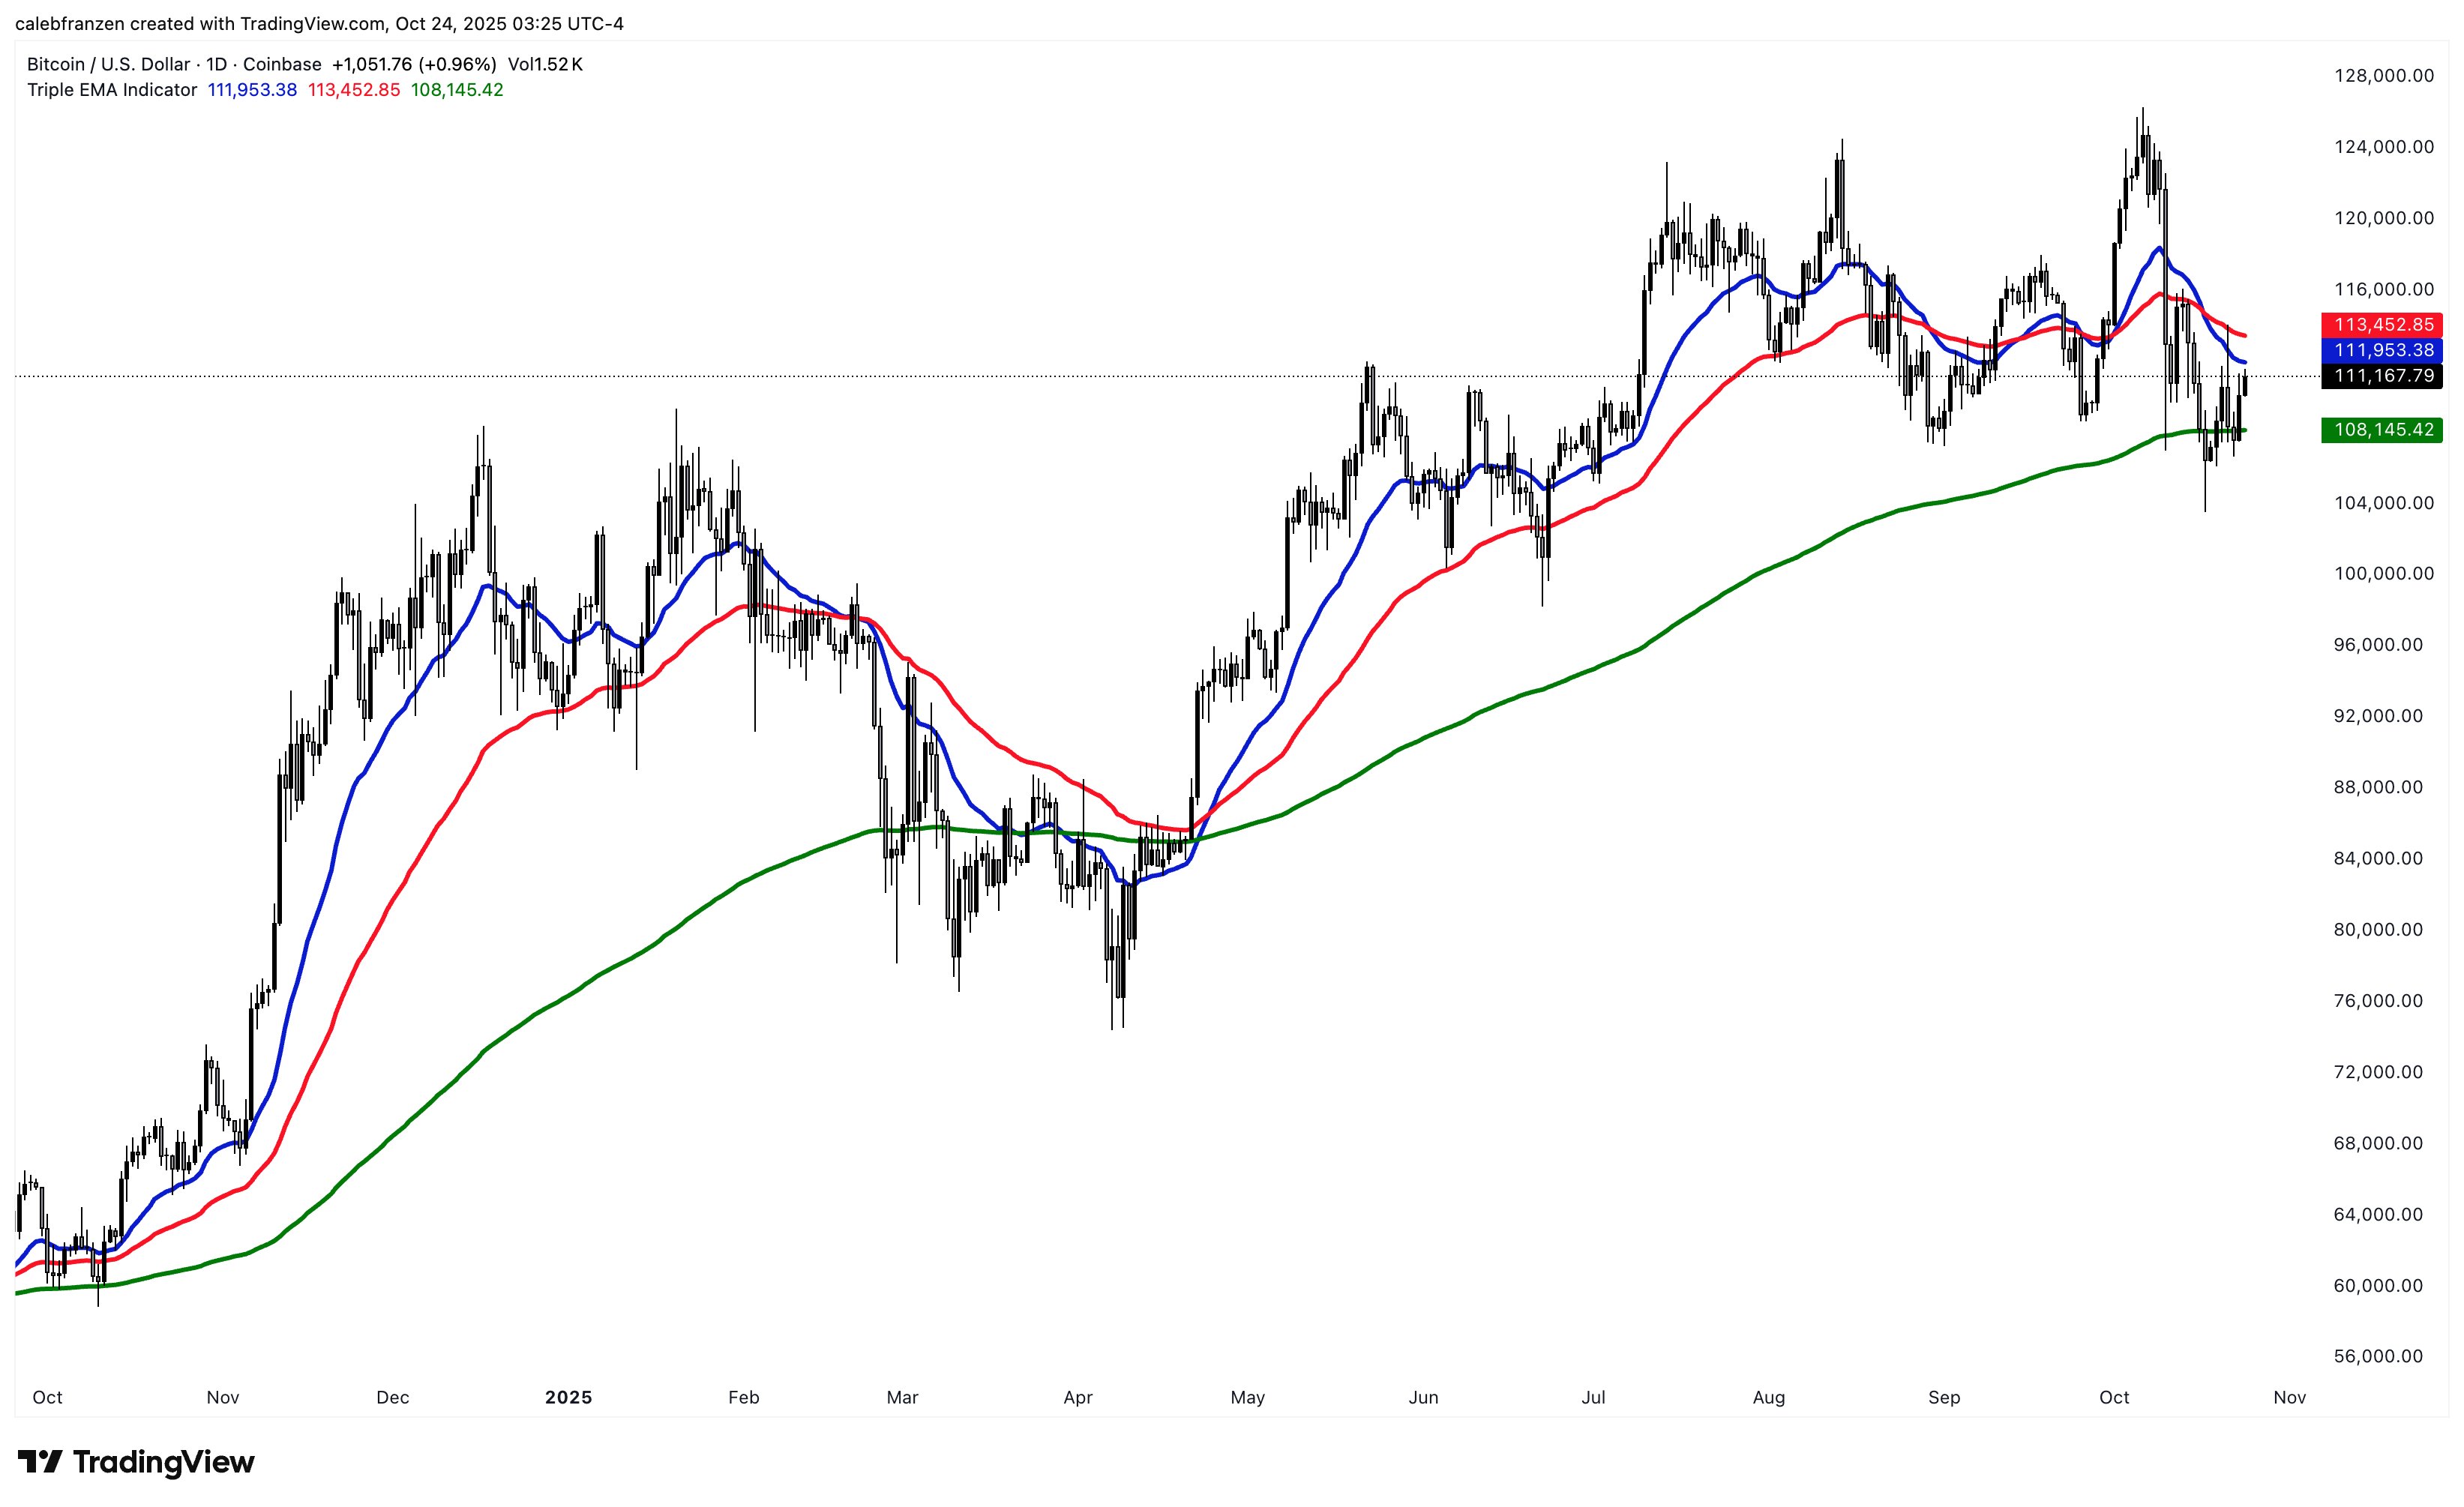 BTC/USD one-day chart with 21, 55, 200 EMAs. Source: Caleb Franzen/X
This article does not provide investment advice or endorsements. Every financial decision bears risks, and readers should do their own due diligence.
