Ethereum's Price Prospects: Key Levels Amid Ongoing Consolidation
Ethereum's price remains constrained in a critical range, with market participants anticipating a potential breakout. Technical indicators suggest consolidation before any definitive movements.


Ethereum continues to exhibit volatile price movements, trapped within a significant range as both buyers and sellers await a decisive breakout. Further consolidation appears probable before a clearer direction is established.
Technical Analysis
Daily Chart
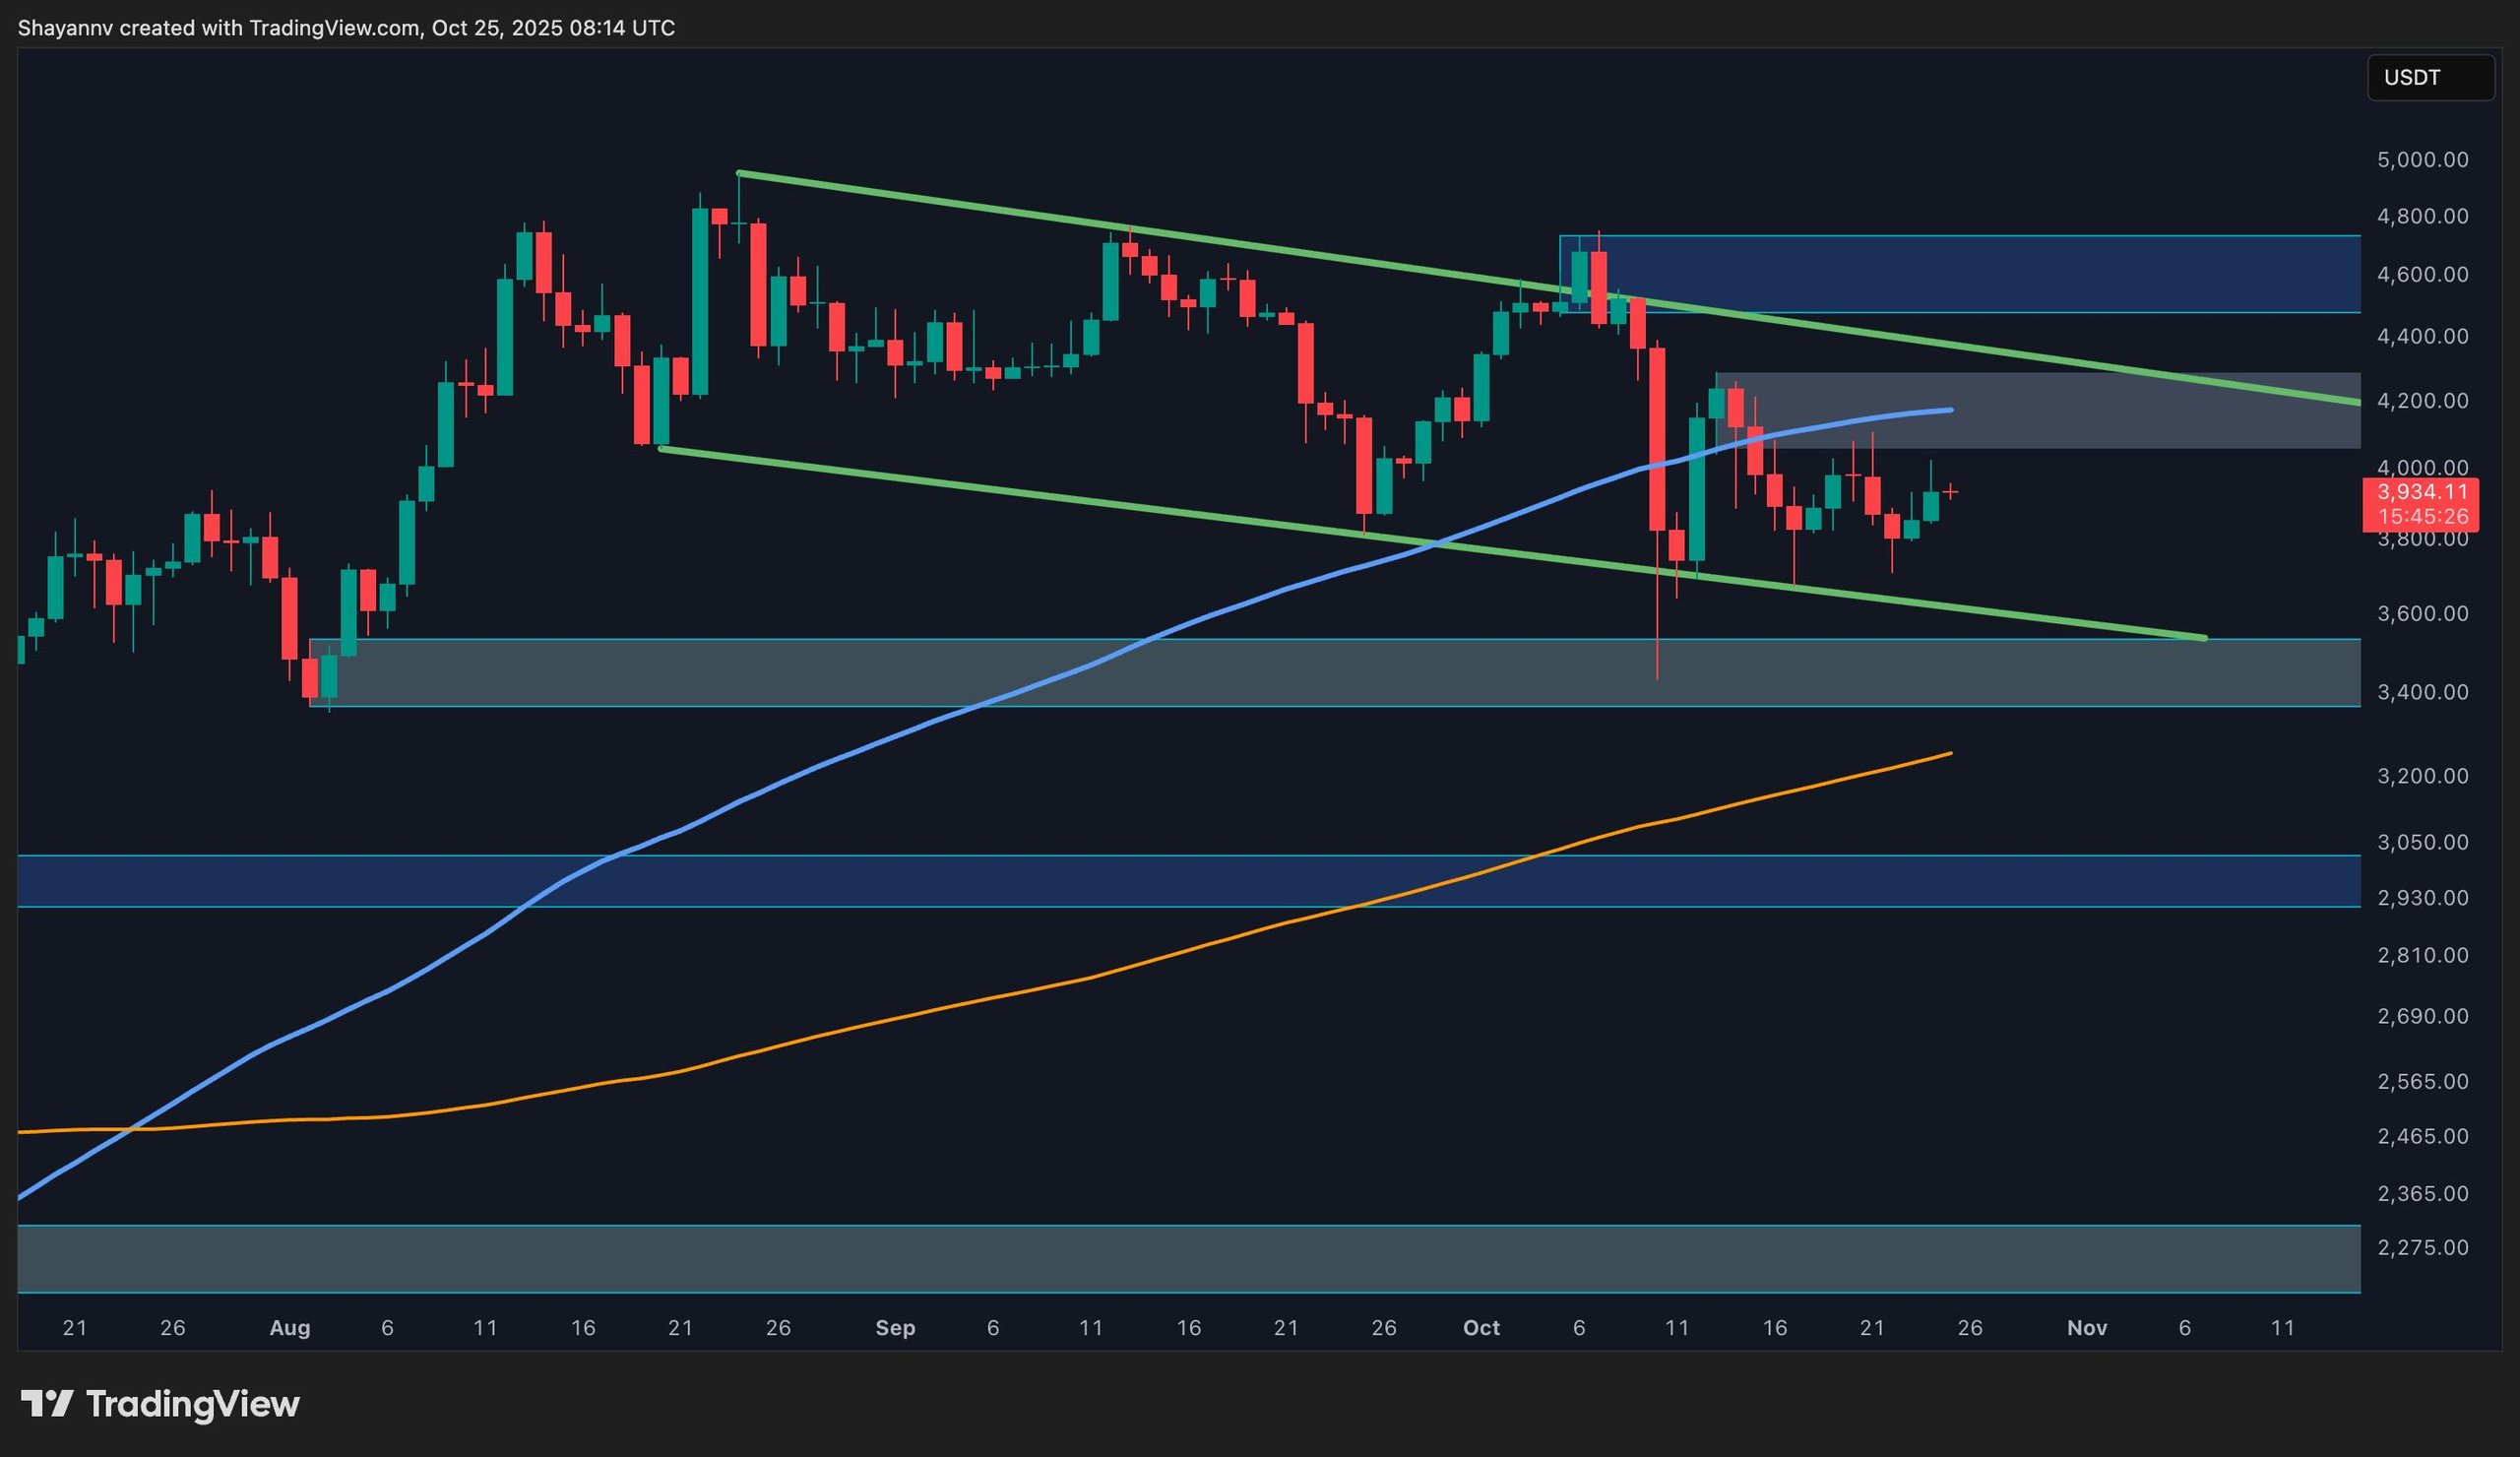
Currently, Ethereum is in an extended consolidation phase, where volatility and momentum have decreased. The price is constrained within a vital range defined by the 100-day moving average and the flag pattern’s upper limit close to $4,100. This area serves as a notable supply zone, consistently rejecting upward advances.
On the lower side, the flag’s bottom boundary, which aligns with the $3,500 demand area, serves as primary support, where buyers have successfully defended their positions. Until a breakout takes place, Ethereum is expected to persist in this consolidative pattern, gathering liquidity before a potential bullish push beyond $4,100, which could lead to an impulsive rally toward new all-time highs.
Daily Chart
4-Hour Chart
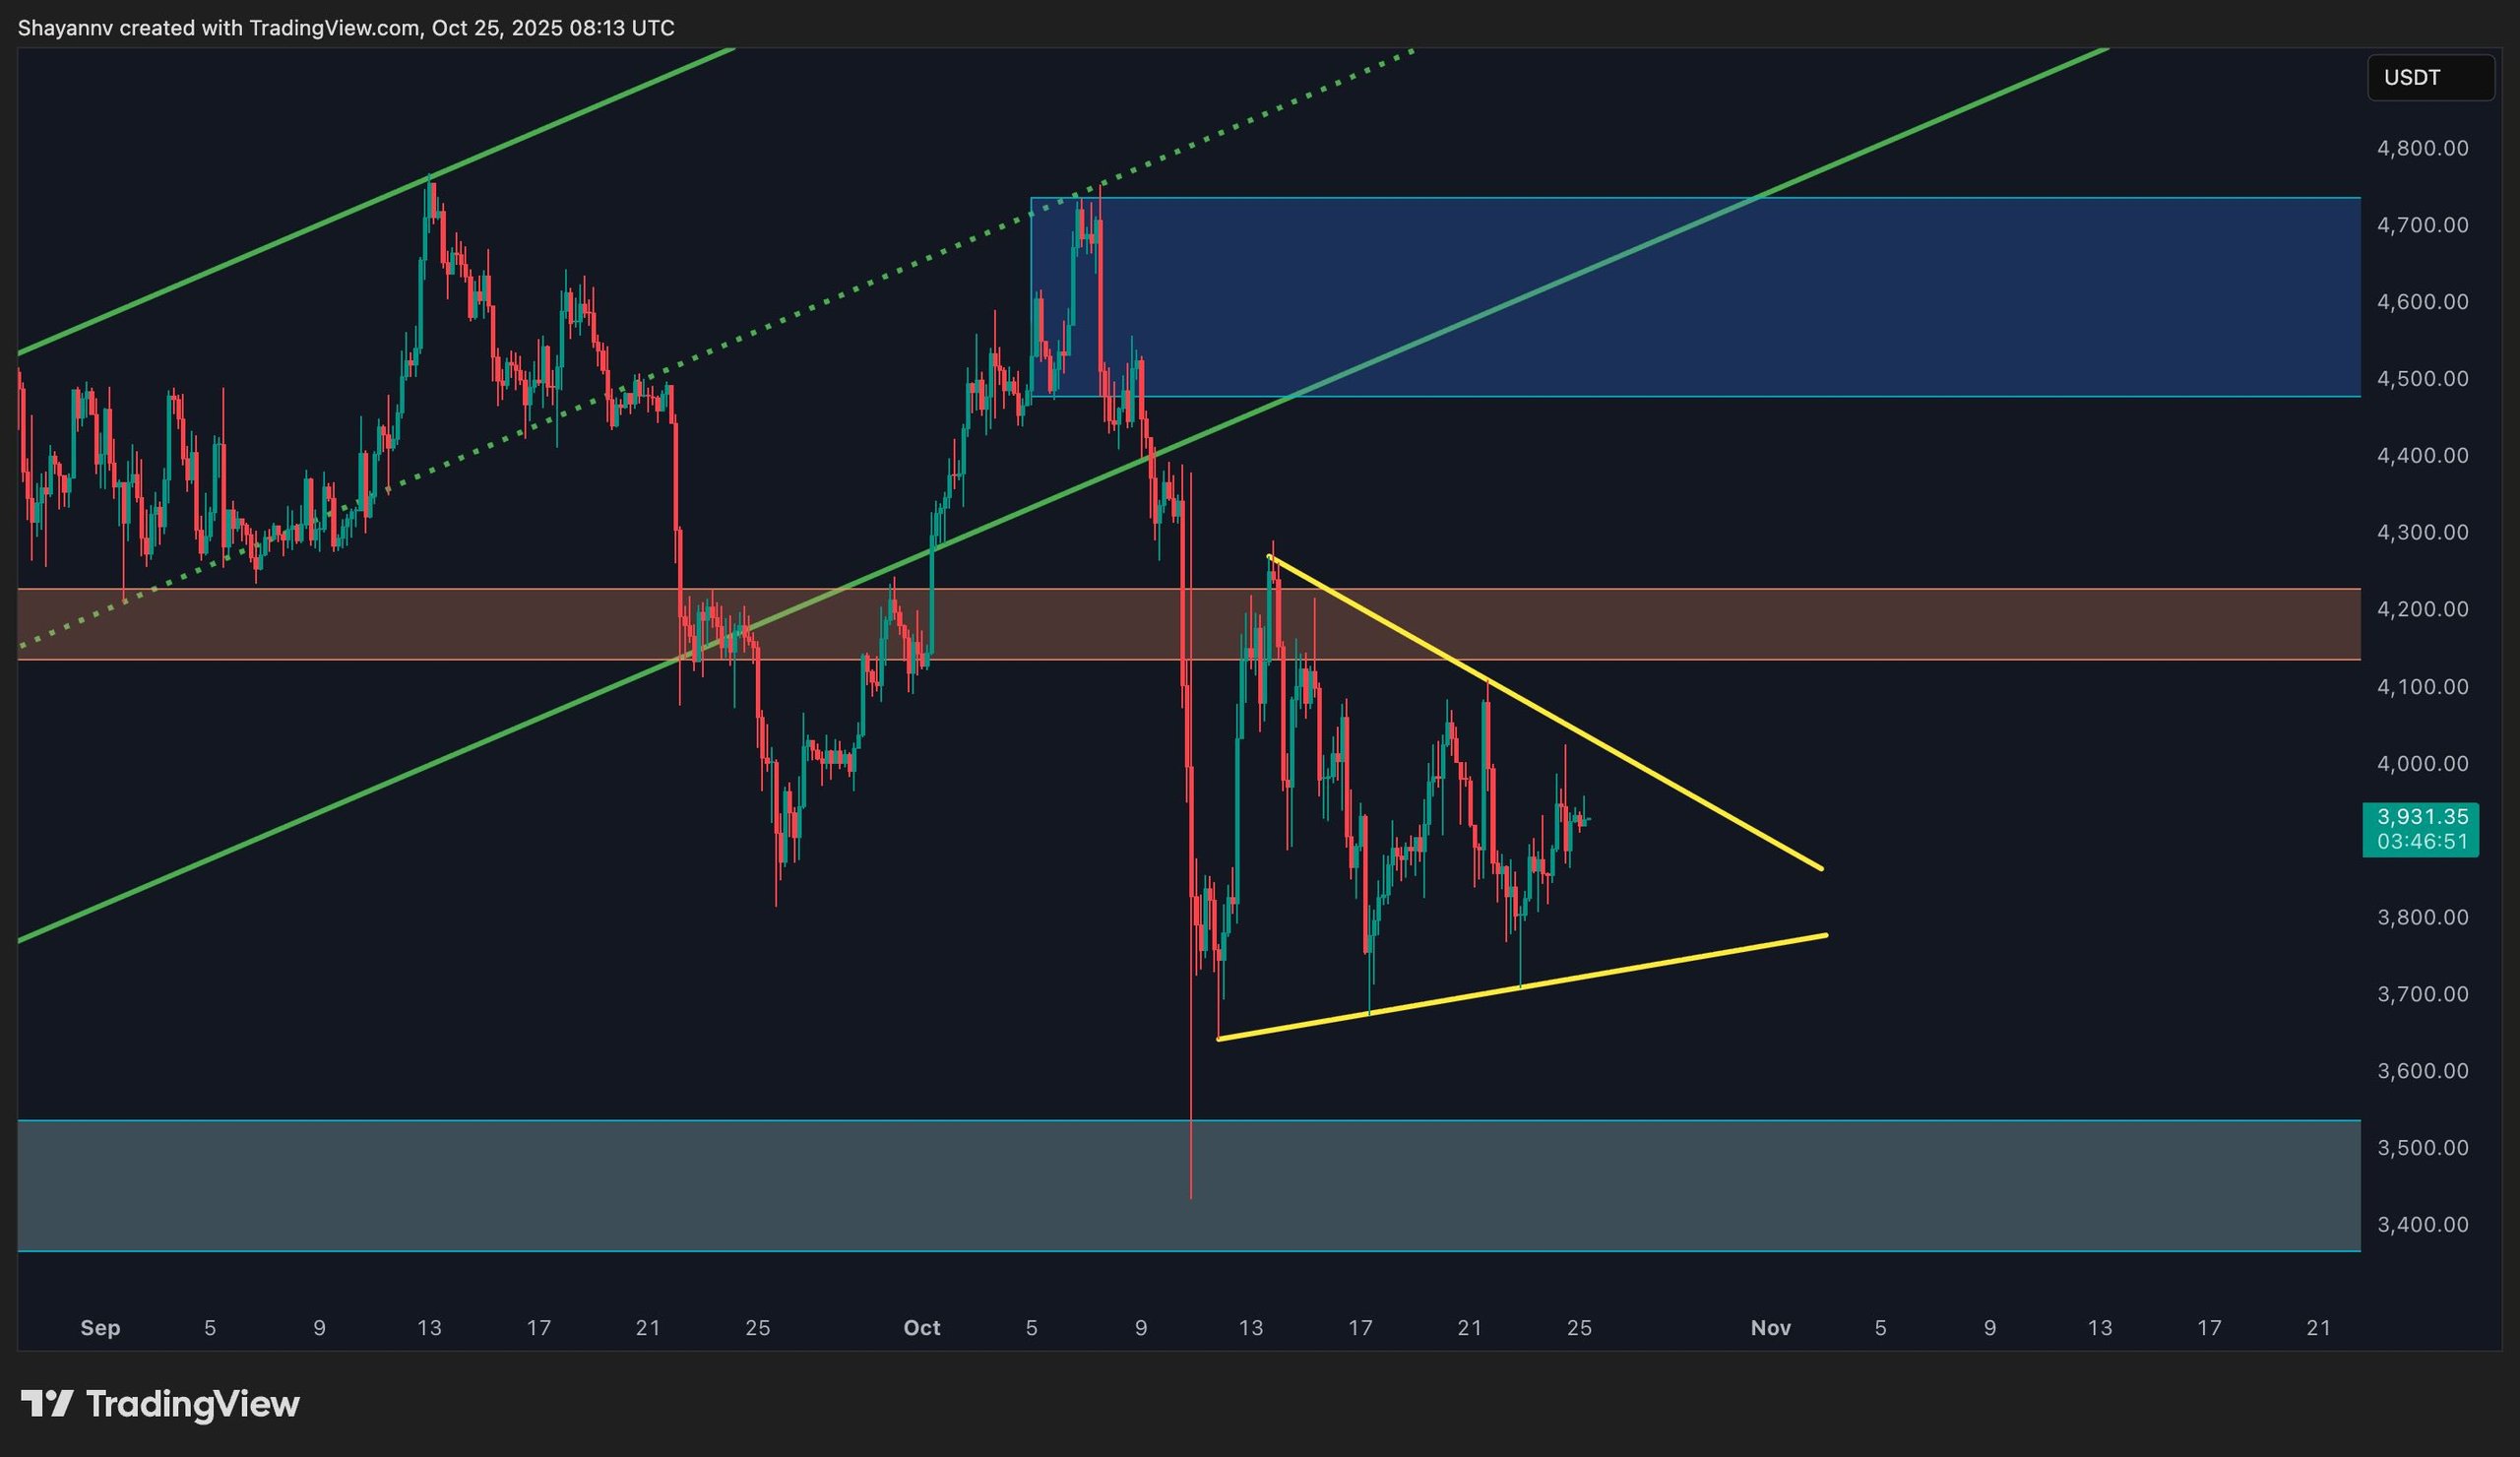
In the 4-hour timeframe, Ethereum is fluctuating within a symmetrical triangle, signifying ongoing indecision in the market. Currently trading just beneath the triangle’s upper boundary near $4,000, momentum remains inadequate for a confirmed breakout.
If bulls can surpass the upper trendline, a rally toward $4,100 and possibly $4,600 may ensue. Conversely, a breakdown below $3,700 could lead to revisiting the $3,400 demand zone. Until a confirmation arises, Ethereum will likely continue fluctuating in this narrowing range, a typical precursor to a significant directional breakout.
 4-Hour Chart
Sentiment Analysis
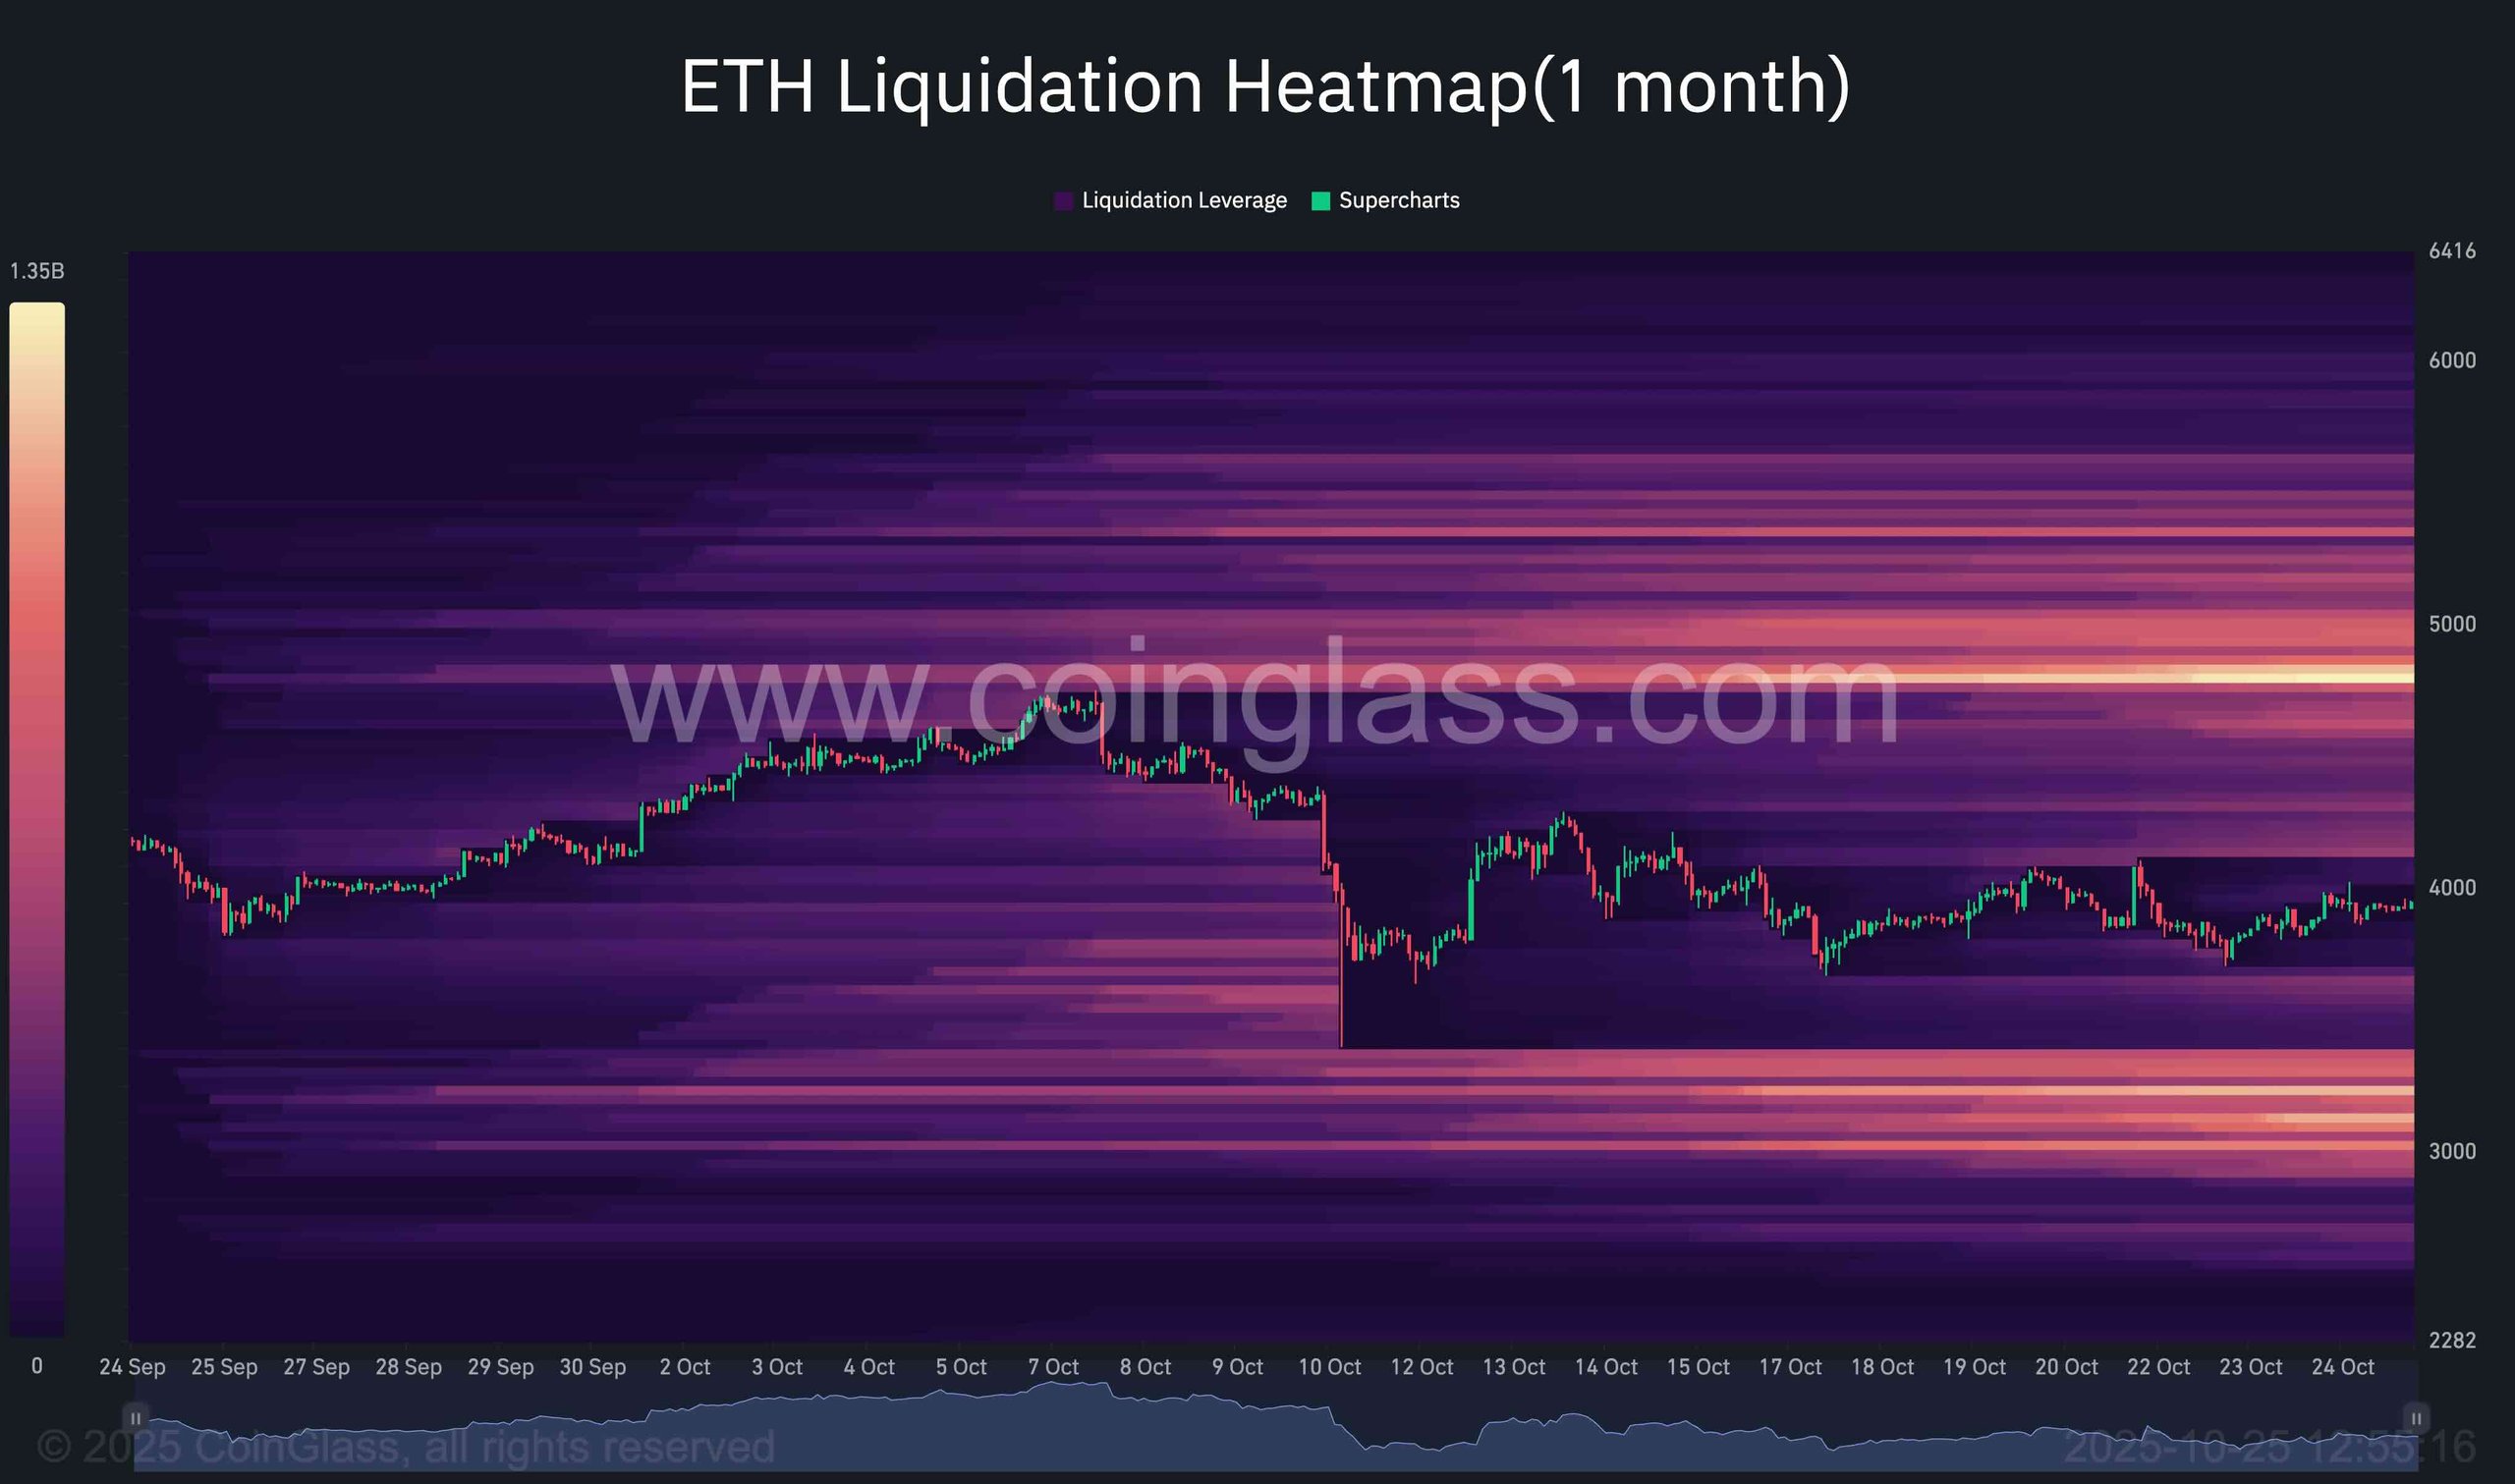
The liquidation heatmap for Ethereum over the past month indicates a dense pocket of liquidity situated above the $4,800 swing high, closely beyond the current symmetrical consolidation. This region corresponds to a substantial concentration of short liquidations. If Ethereum can reclaim the mid-range near $4,100 to $4,300, a swift response to absorb this overhead liquidity may follow.
The $3,500 range exhibits a comparatively lower density of liquidations, reflecting that the majority of downside liquidity was cleared during last week’s sell-off, albeit a small residual cluster remains. This arrangement reinforces the notion that Ethereum is likely to continue oscillating within its current consolidation range until one of these liquidity pockets is decisively tested.
Overall, the heatmap suggests short-term volatility will remain concentrated within the $3,400–$4,800 corridor, with a slightly higher likelihood of reaching the upper range first due to the greater liquidity concentration above present levels.
 Liquidation Heatmap
SPECIAL OFFER (Sponsored)
Binance Free $600 (CryptoPotato Exclusive): Use this link to register a new account and receive a $600 exclusive welcome bonus on Binance.
LIMITED OFFER for CryptoPotato readers at Bybit: Use this link to register and open a $500 FREE position on any coin!
