Bitcoin Price Forecast: BTC Might Face Drop to $100K if Key Support is Breached
An analysis of Bitcoin's price movements and outlook as it fluctuates around significant moving averages.


Bitcoin Price Forecast: BTC Might Face Drop to $100K if Key Support is Breached
Bitcoin is currently trapped in a crucial mid-range scenario, fluctuating between its 100- and 200-day moving averages. Despite recent attempts to climb higher, resistance near the 100-day MA has sparked renewed selling pressure.
Technical Analysis
The Daily Chart
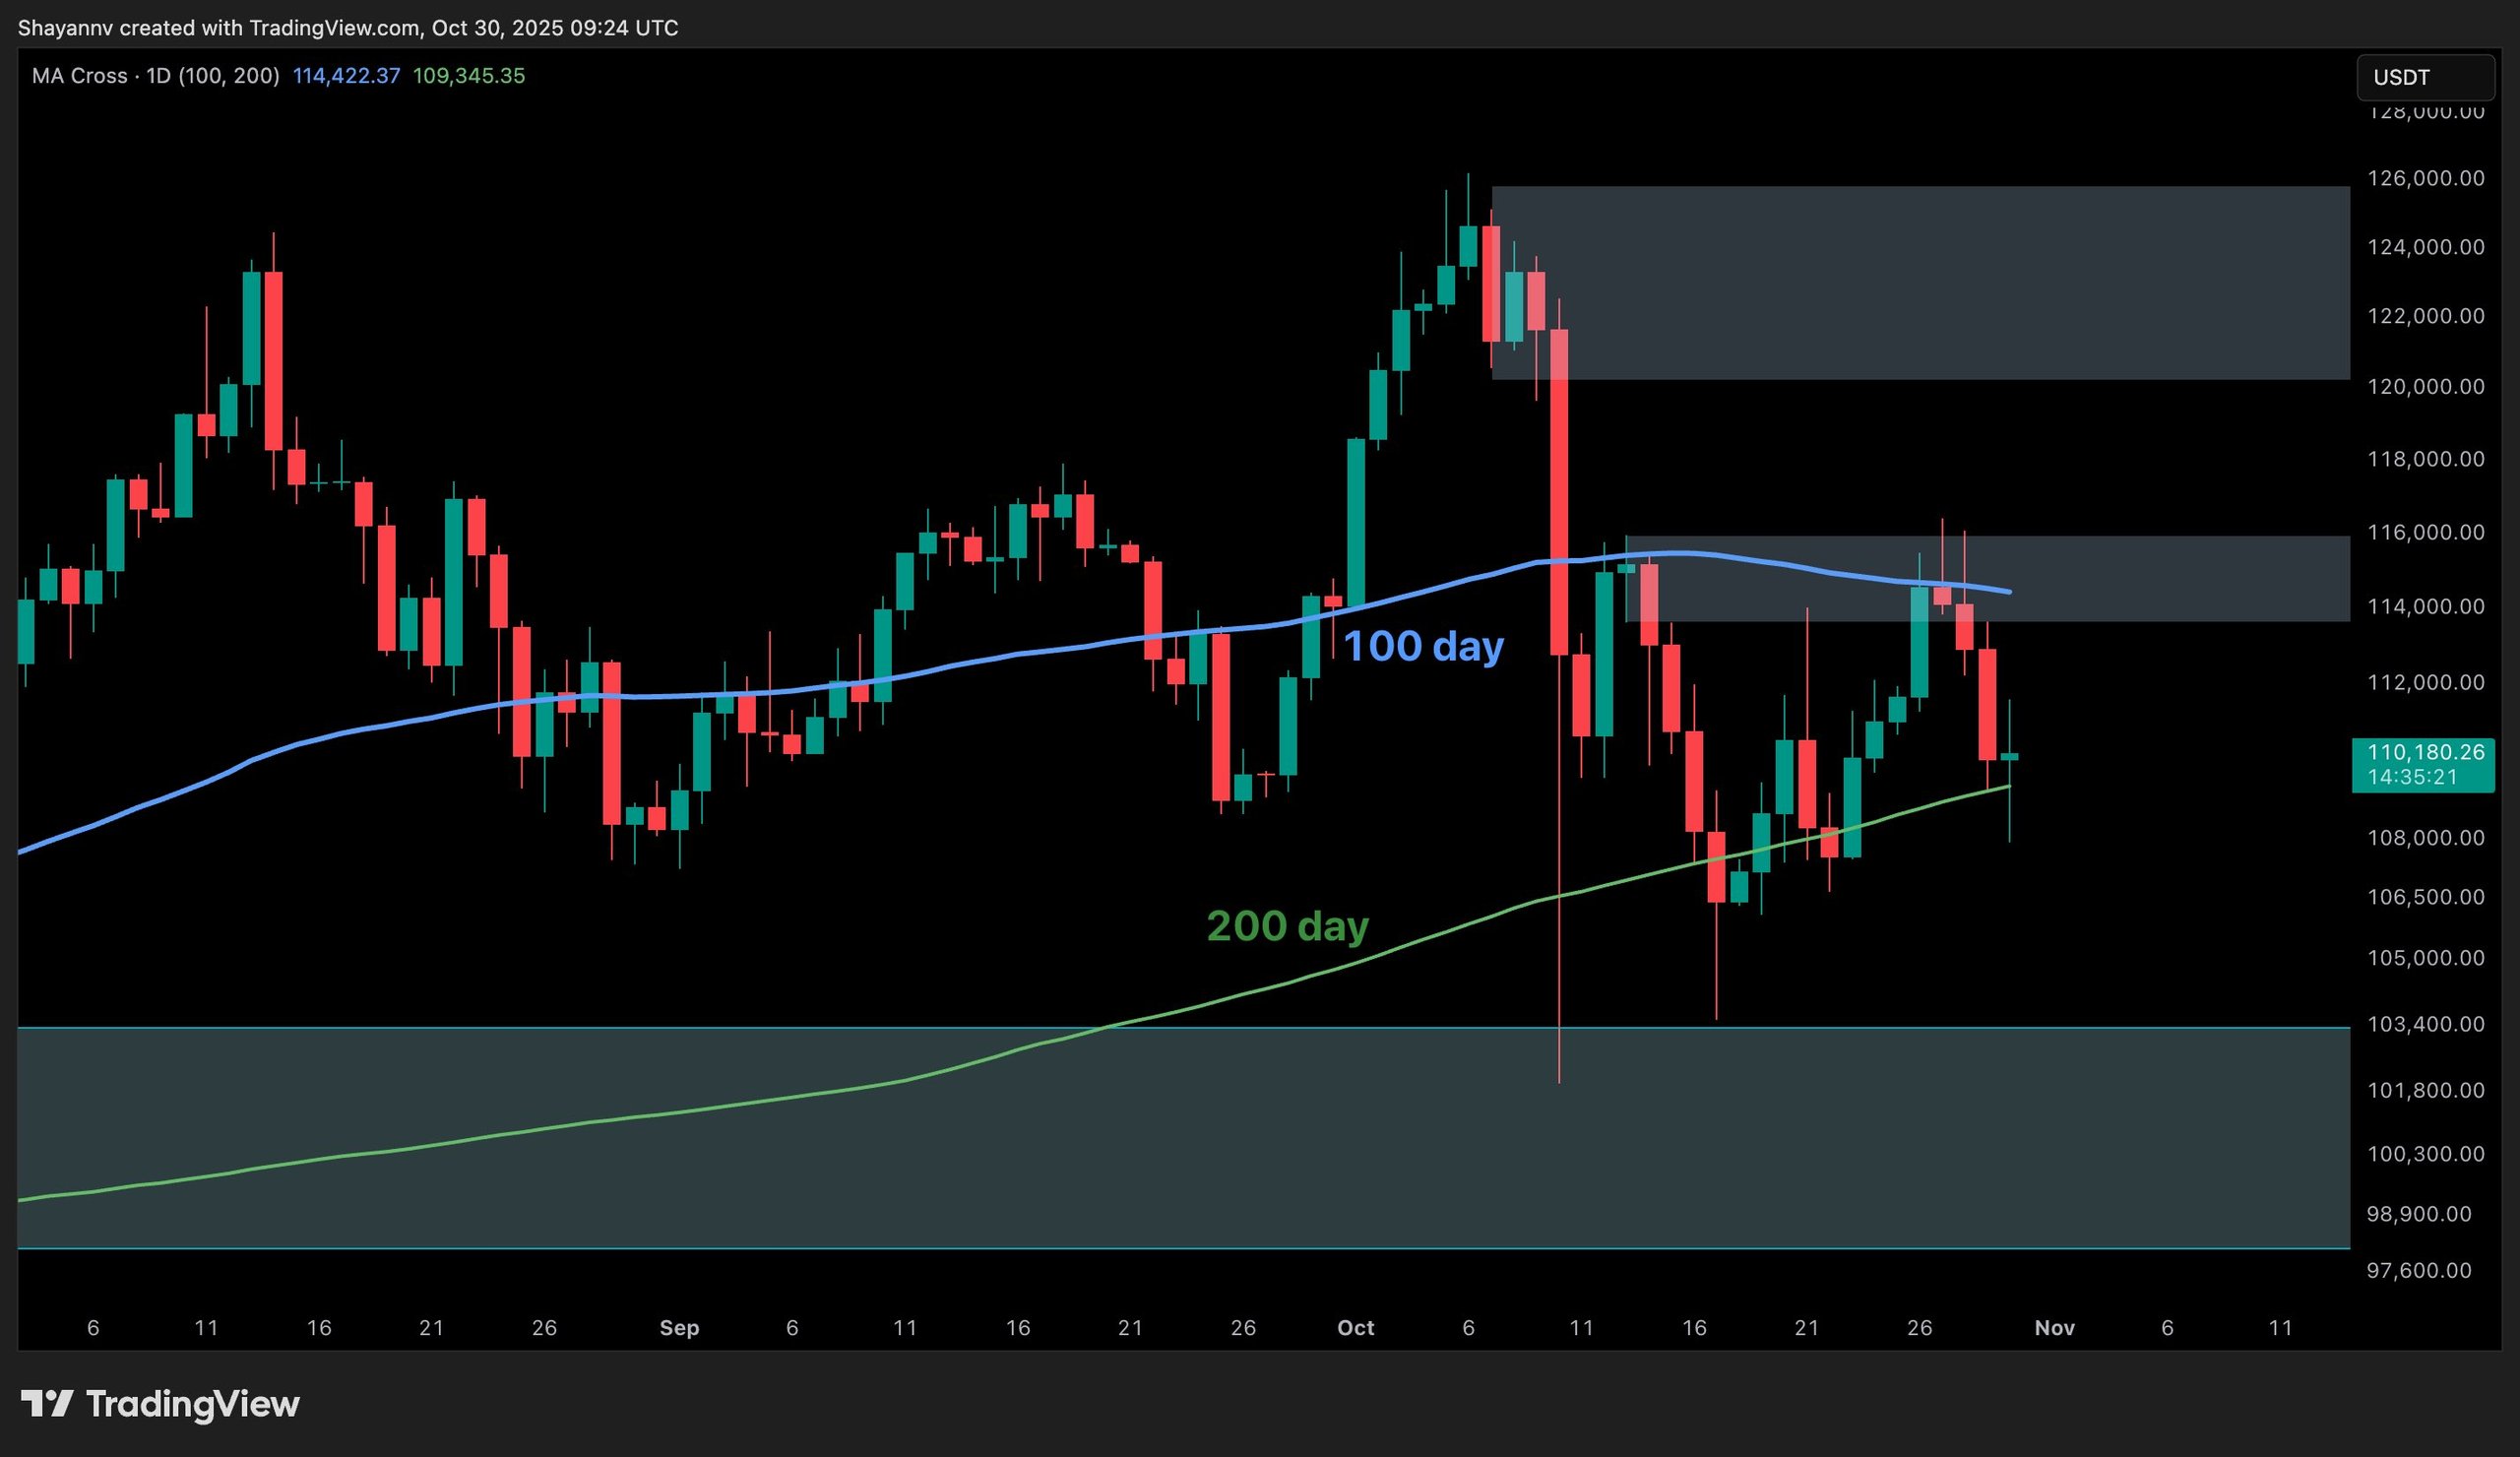
On the daily chart, BTC finds itself between the 200-day MA at $109K and the 100-day MA at $114K, which are significant thresholds. A recent rejection at the 100-day MA followed by a rebound off the 200-day MA highlights this consolidation area.
The range between $114K–$116K continues to be a strong supply zone, coinciding with the midpoint of the recent trading range. A decisive close above $116K could indicate renewed strength, likely supported by improved macro liquidity following recent Federal Reserve rate adjustments, paving the way for Bitcoin to potentially rally towards $120K–$122K.
Conversely, if prices dip below $109K–$110K, we may see a continuation of the corrective phase down to the $102K–$104K area, a prior strong accumulation base.
Bitcoin - Daily Chart
The 4-Hour Chart
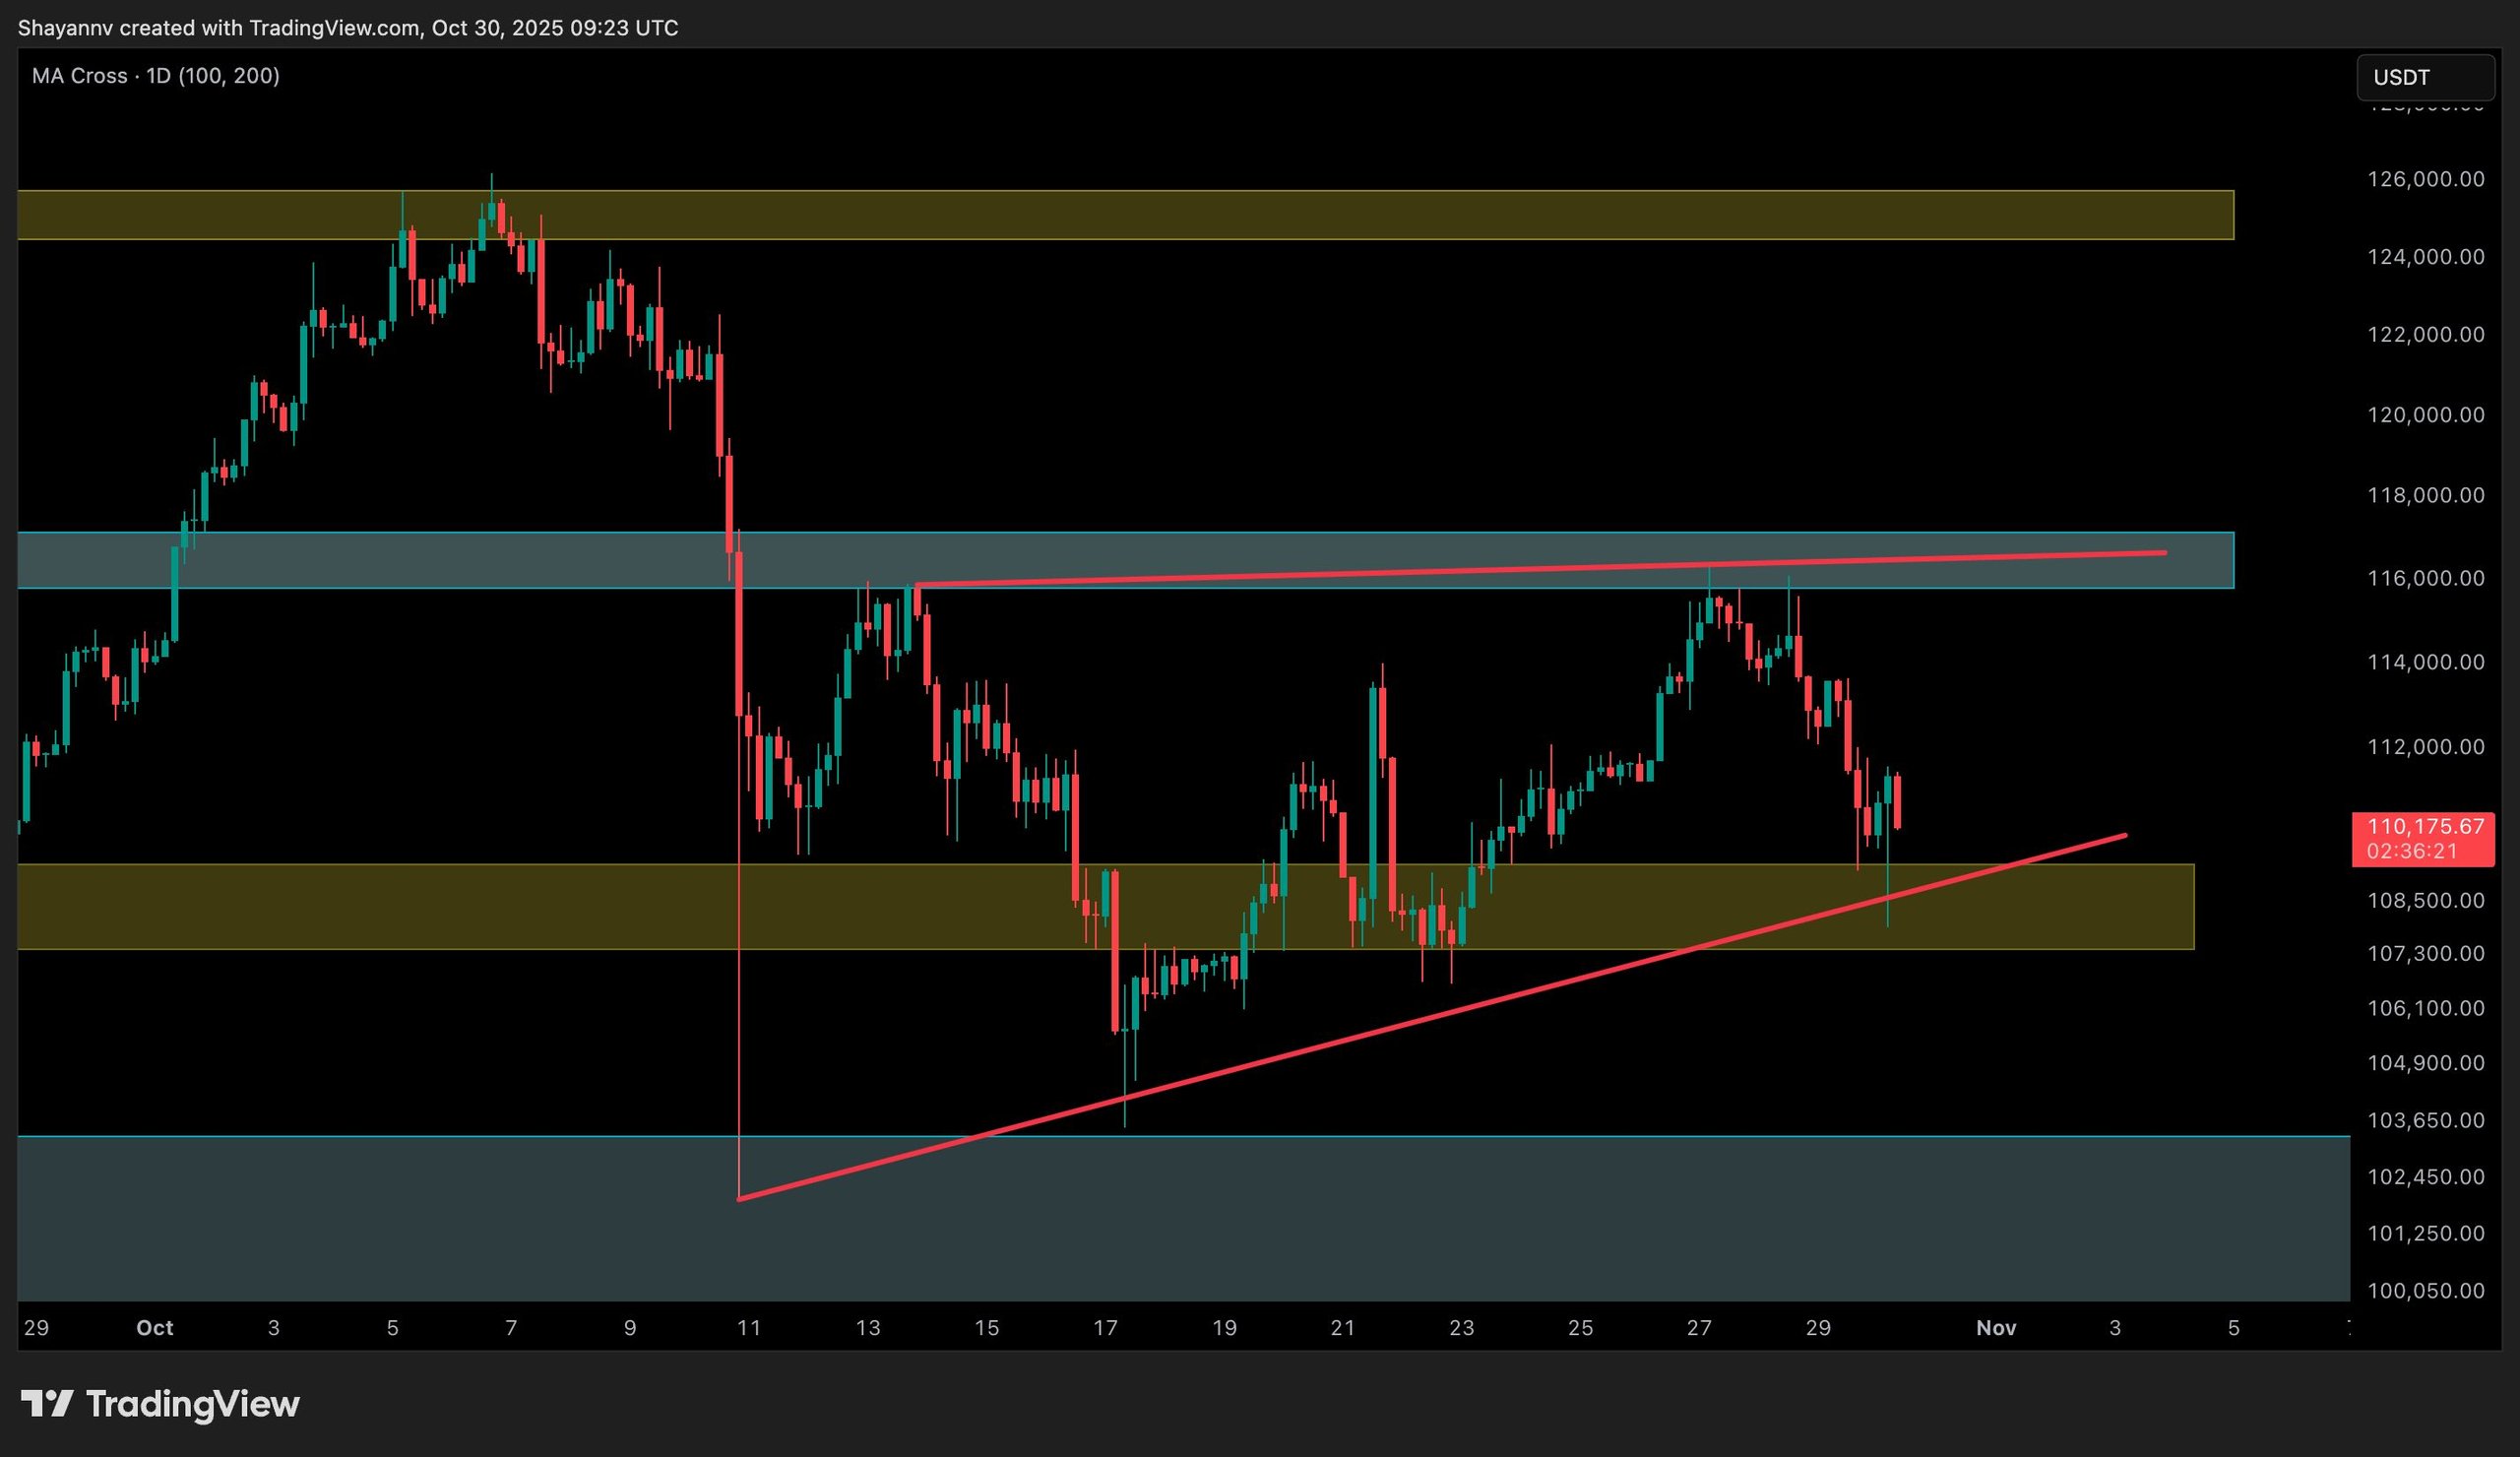
On the 4-hour chart, BTC continues to adhere to an ascending trendline, demonstrating higher lows formed since mid-October. The recent drop from the $116K resistance band has pushed the price back toward this upward support, aligning with the high-liquidity region of $108K–$109K.
This area stands as a crucial short-term decision point. A rebound here would reinforce the prevailing bullish structure, possibly leading to a surge towards $115K–$116K. Should a breakdown occur below $108K, expect a retest of the $102K demand block before any significant reversal attempt can occur.
Overall, the market setup suggests reduced volatility, indicating Bitcoin might be gearing up for a substantial breakout as global markets react to the Federal Open Market Committee’s dovish stance and an enhancing geopolitical climate.
 Bitcoin - 4 Hour Chart
Spot Sentiment Analysis
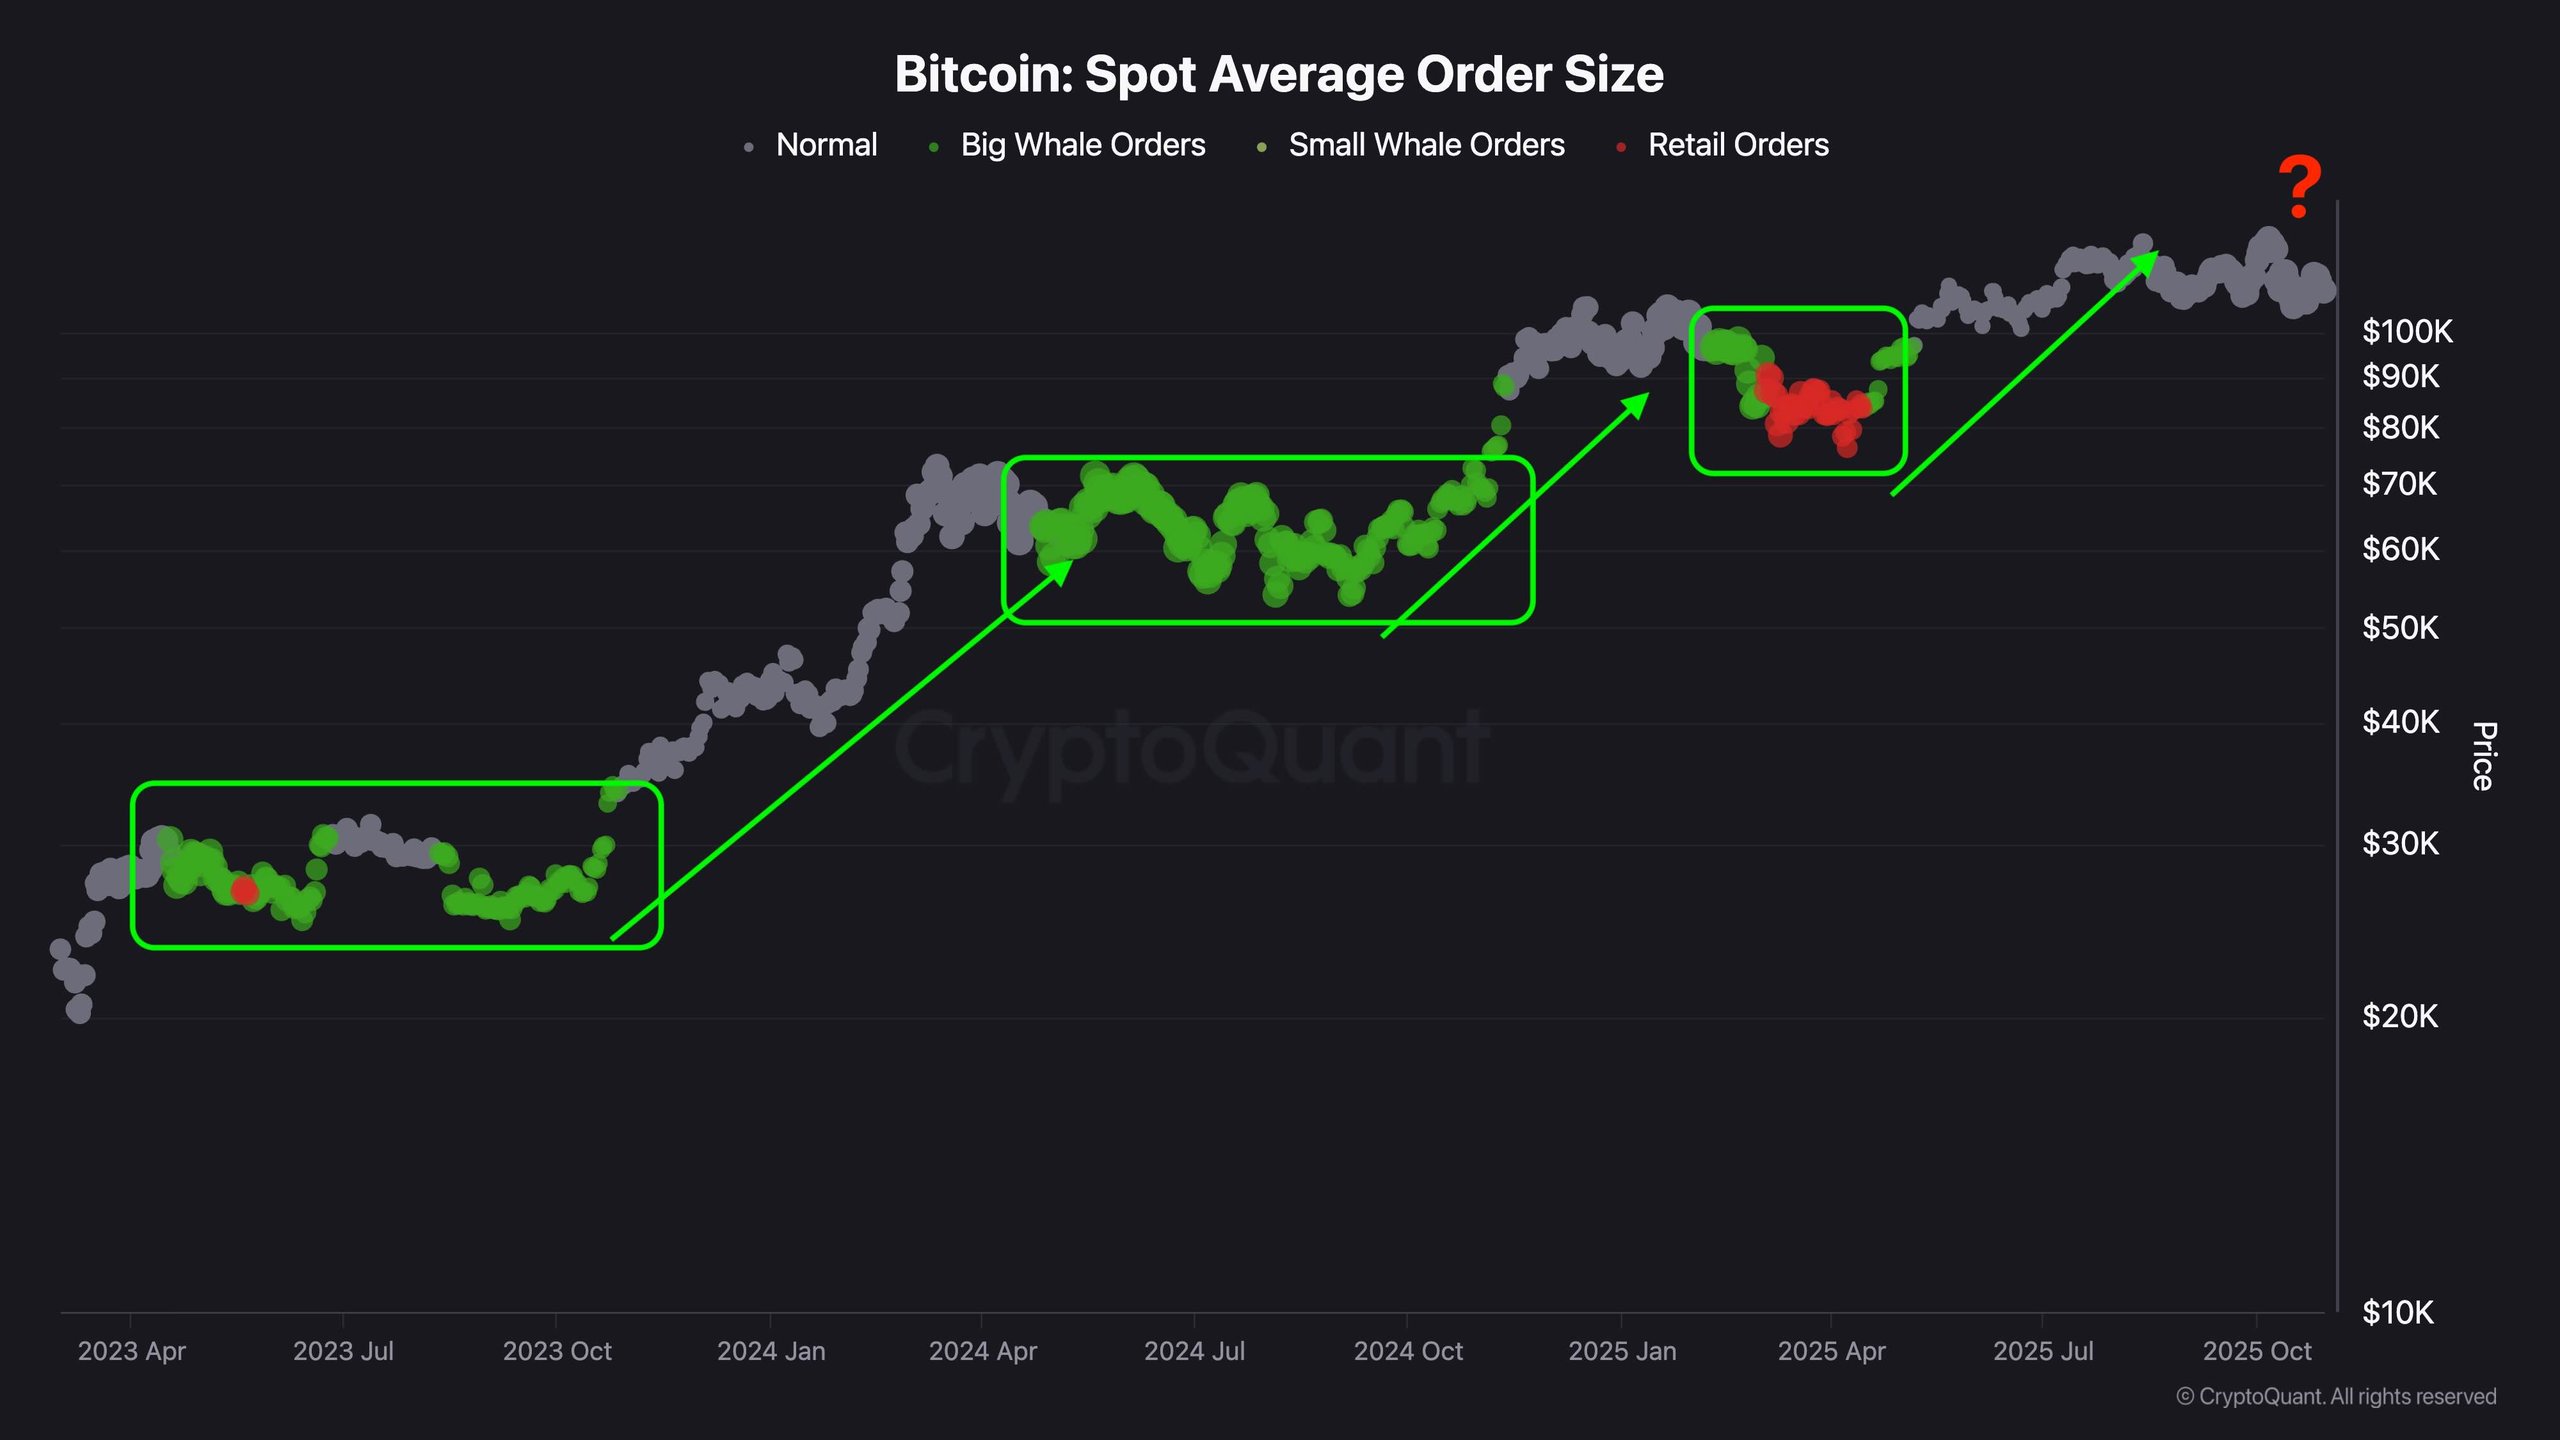
The Spot Average Order Size metric provides key insights into market engagement dynamics. Historically, increases in larger spot order sizes indicate accumulation phases led by institutional buyers, while smaller retail-focused orders typically denote distribution or sideways trends.
Currently, there is a noticeable drop in larger order activities, suggesting short-term caution despite favorable macro conditions. This trend parallels previous consolidation phases before significant expansions, hinting that the market may be in yet another re-accumulation phase.
Should large order activity increase in the $108K–$110K region, it would signal renewed institutional accumulation, likely aligning with the liquidity injection effects from the recent U.S. rate cut and market stability in U.S.-China trade relations. Together, these factors could establish a foundation for Bitcoin’s next macro bullish trend.
 Spot Average Order Size
Disclaimer: The information provided is based on the analysis of market conditions. Conduct your own research before making investment decisions.
