


Key Takeaways:
- The price of ZEC surged 500% in October, driven by celebrity endorsements and short liquidations.
- A rising wedge pattern warns of a potential 30% correction towards the support zone of $260–$270 in November.
Zcash (ZEC) is causing a stir this Halloween as it emerges as one of the few cryptocurrencies experiencing notable gains. Recently, ZEC climbed 7.75% to reach $390.75, marking its highest point since 2018, while the overall crypto market capitalization dropped by 2.50% during the same timeframe.
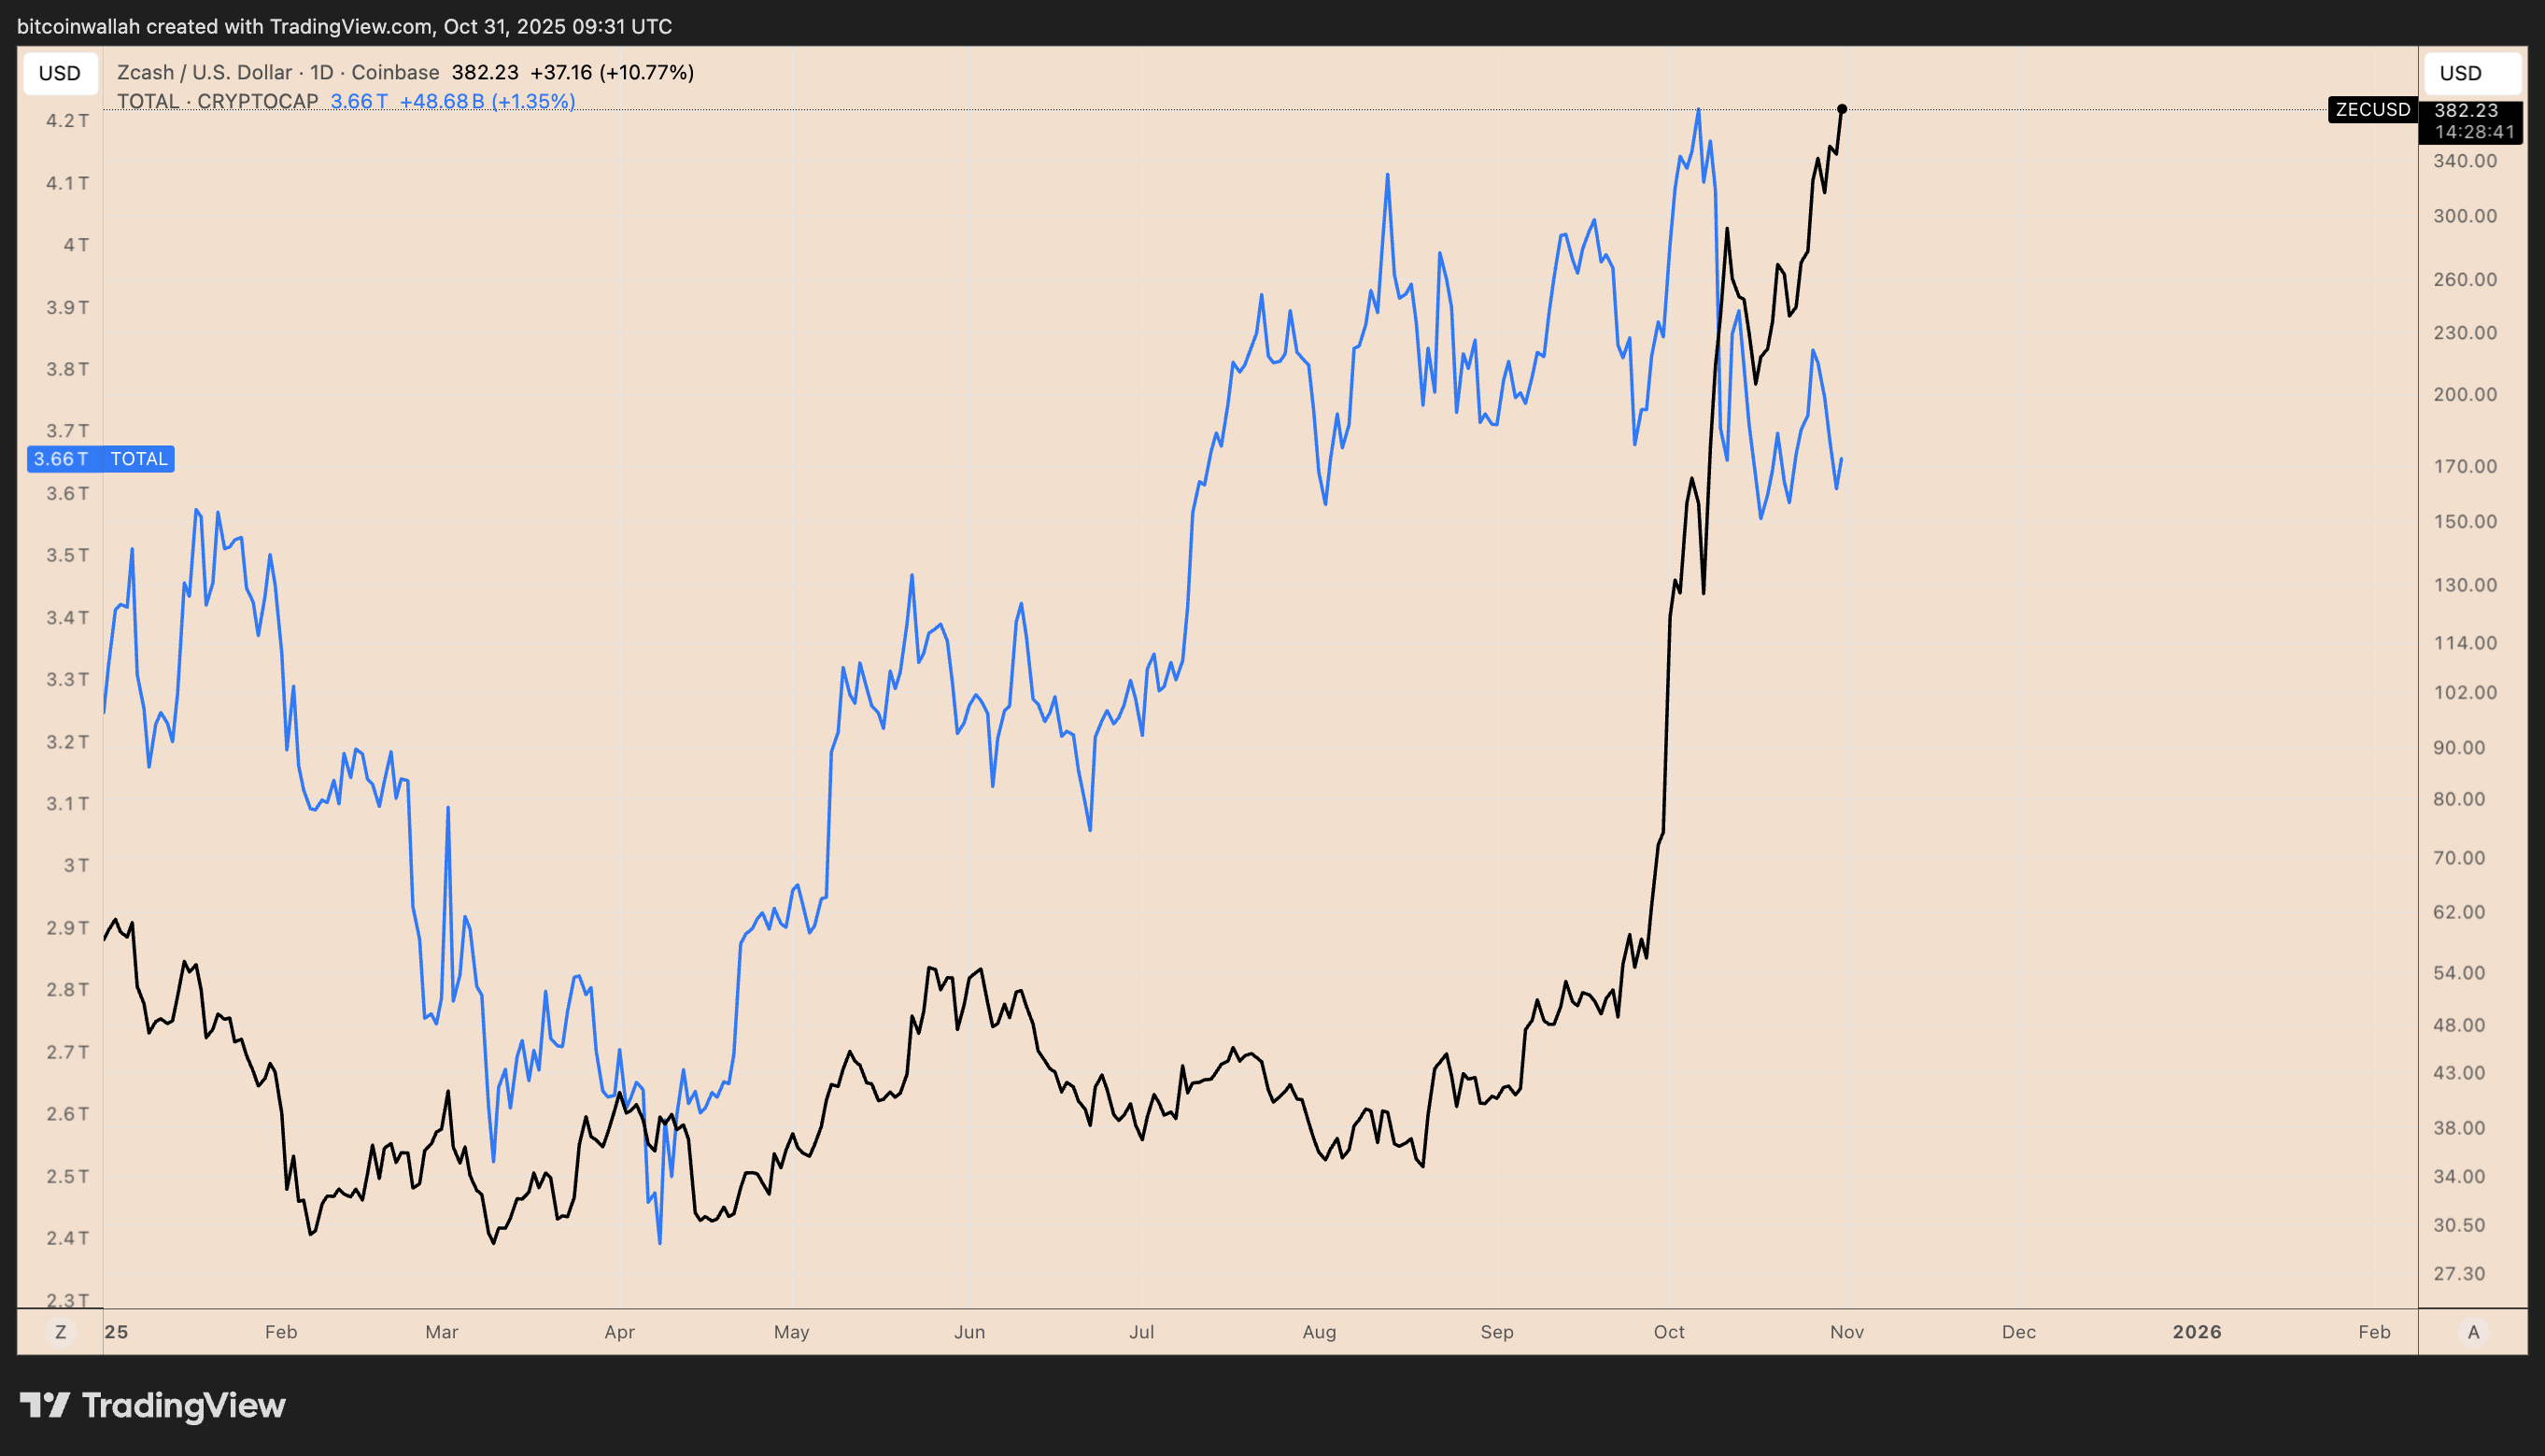 ZEC/USD vs. TOTAL crypto market cap daily chart. Source: TradingView
ZEC price has increased nearly 500% in October, starkly contrasting the market’s 4.50% drop.
The Influence of Crypto Celebrities
Notable endorsements have turbocharged the bullish sentiment for ZEC. The cryptocurrency began its ascent after renowned investor Naval Ravikant dubbed it as an “insurance against Bitcoin” on October 1. The price surged over 60% on that very day and maintained its upward trajectory.
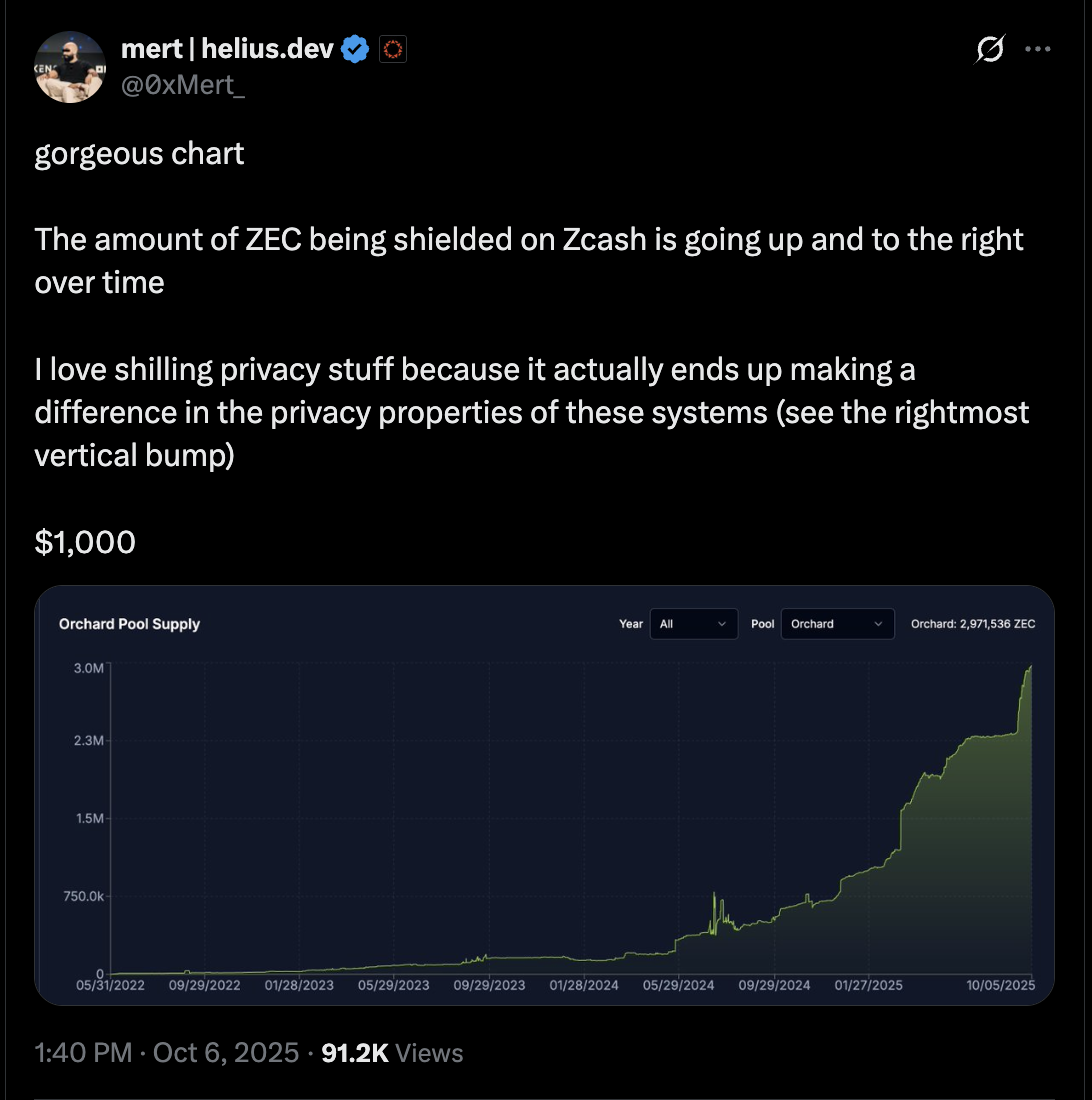
Mert Mumtaz, the CEO of Helius, a Solana-focused development firm, publicly set a target price of $1,000, which brought Zcash into the limelight and incited momentum traders to jump aboard. Additionally, Arthur Hayes, co-founder of BitMEX, stoked interest with a prediction of a $10,000 price point, which led to a 30% increase in ZEC.
 Source: X
These promotional activities echo the price movements seen by Dogecoin (DOGE) in 2021, where the memecoin experienced an average increase of 33% following tweets from Elon Musk, according to researcher Dabian Fablander.
Short Liquidations Fuel the Surge
The hike in Zcash’s value has been further propelled by short liquidations. ZEC futures reported nearly $65 million in liquidations over the last fortnight, with over half attributed to short positions, based on estimations from CoinGlass.
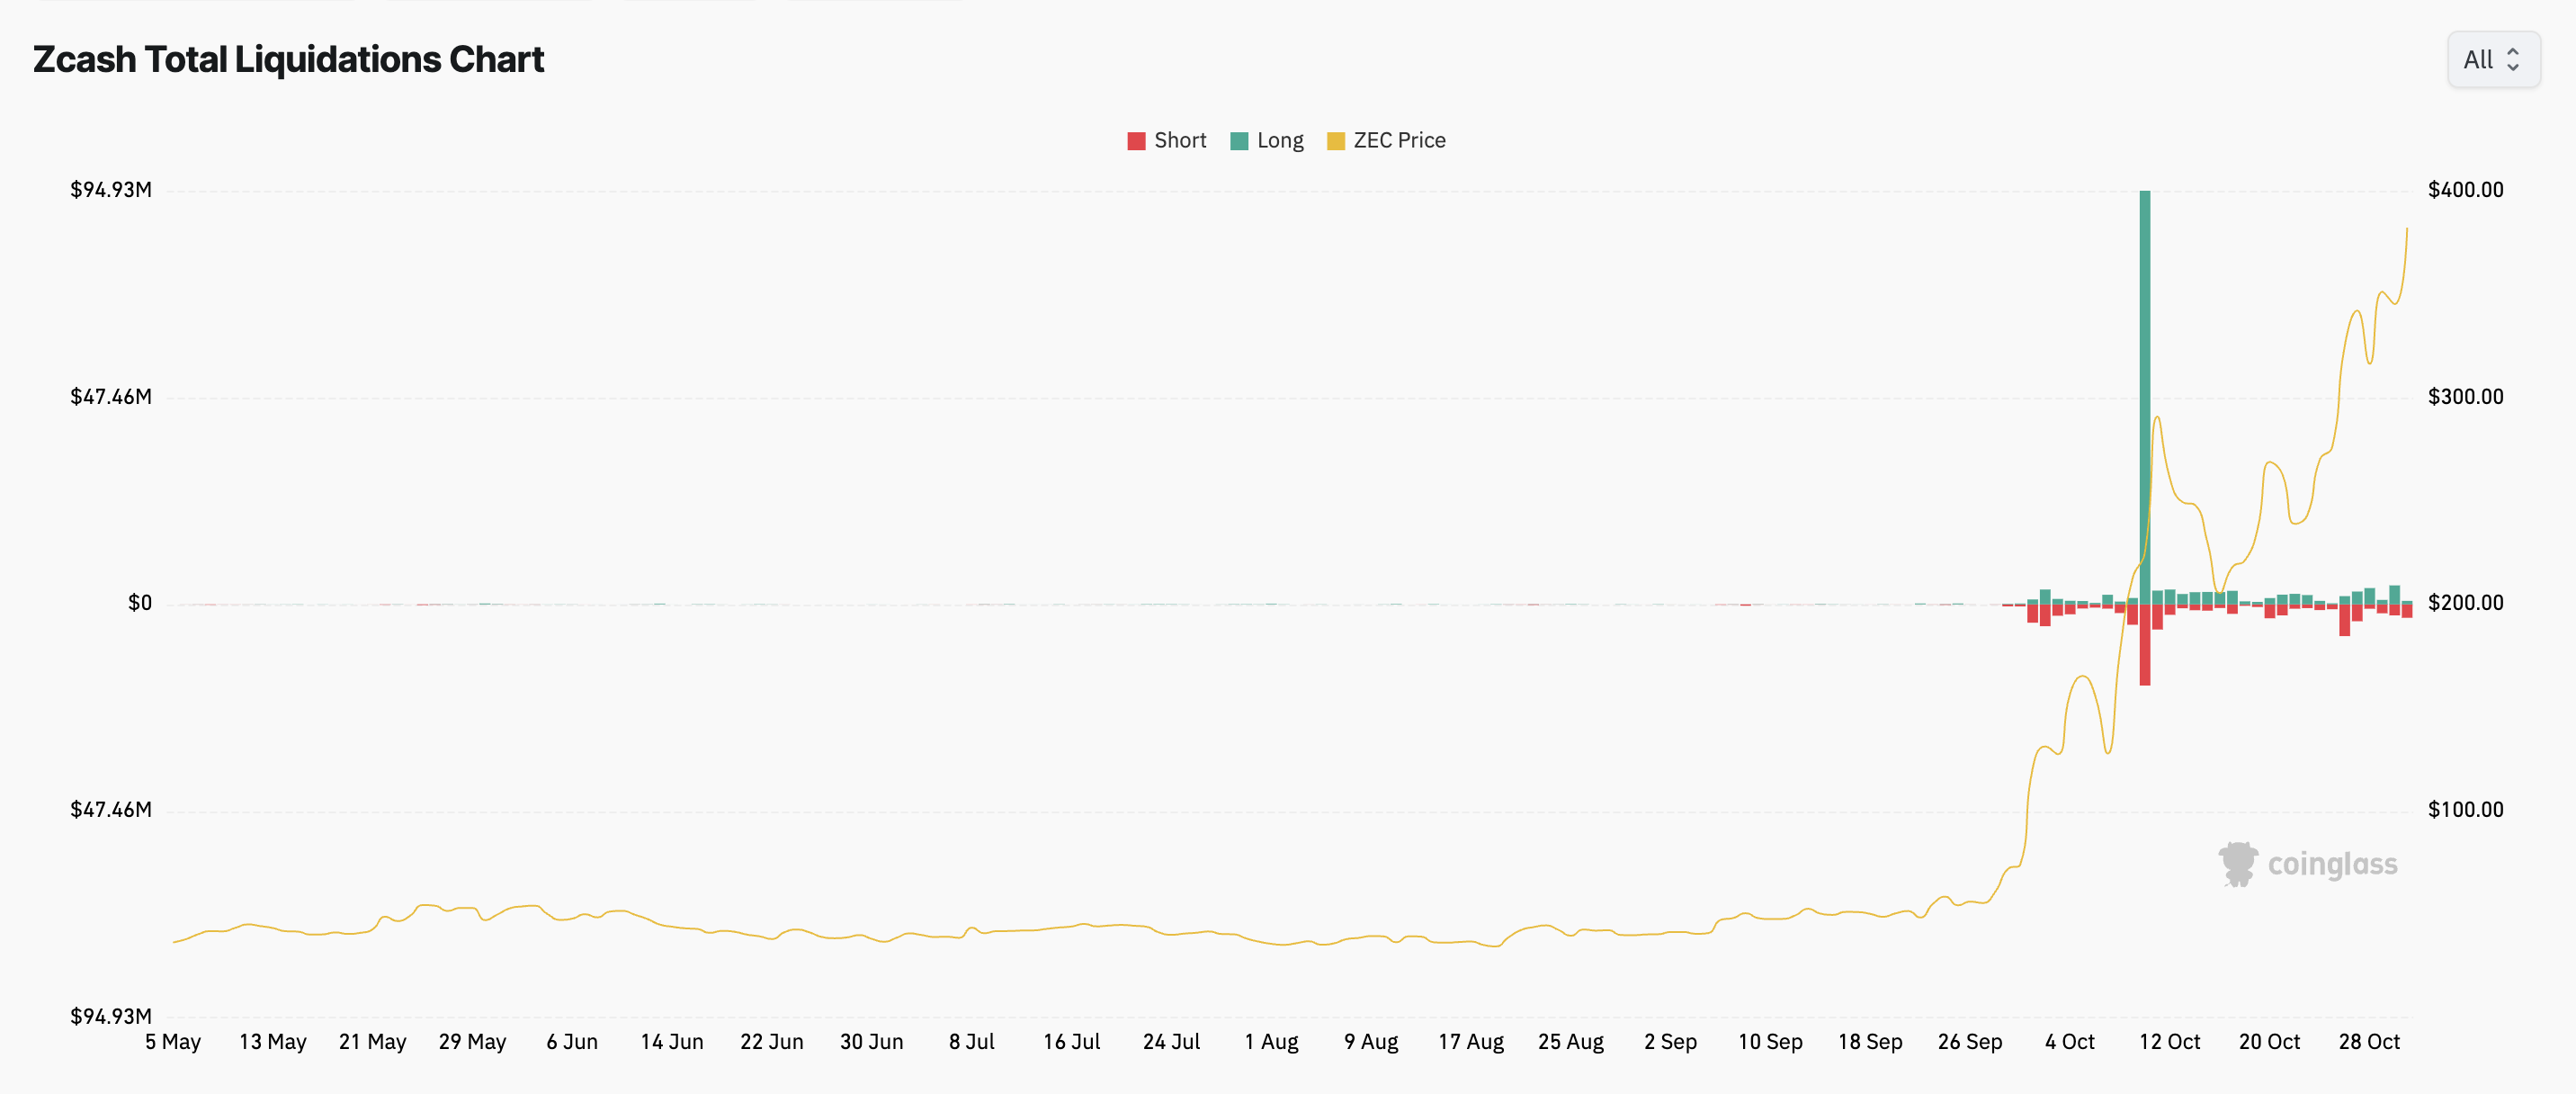 Zcash total liquidation chart. Source: CoinGlass
This development indicates ZEC’s breakouts have been fueled by a classic short squeeze, forcing those betting against the cryptocurrency to close their positions as prices rose. Coupled with rising retail interest, evidenced by spikes in internet searches for “Zcash,” this has helped maintain momentum.
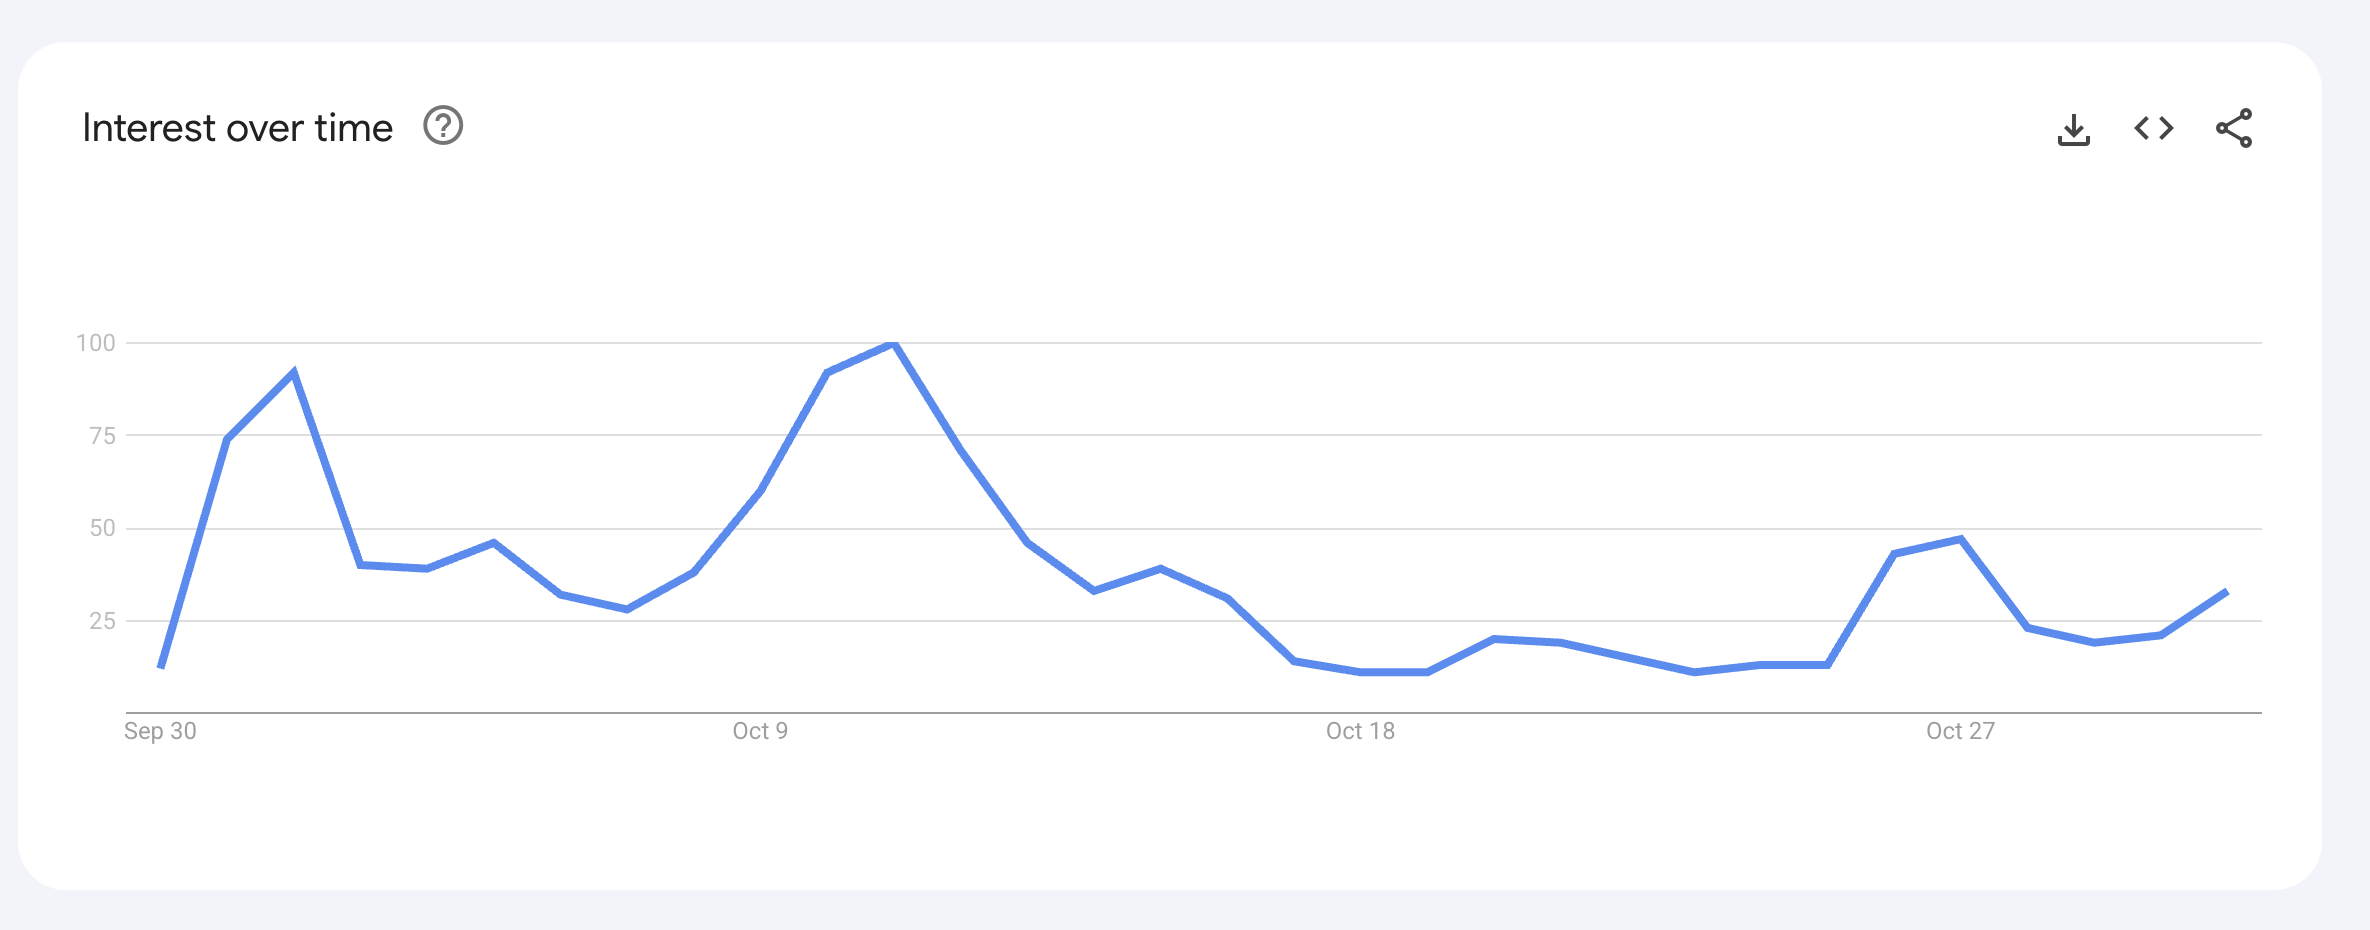 Zcash 30-day internet search trend. Source: Google Trends
Technical Analysis Points to a Possible Correction
On the daily charts, ZEC is showing a rising wedge pattern, which often precedes bearish corrections following bullish trends. The upper limit of the wedge is currently around $450, indicating that ZEC might continue to rise slightly before losing steam.
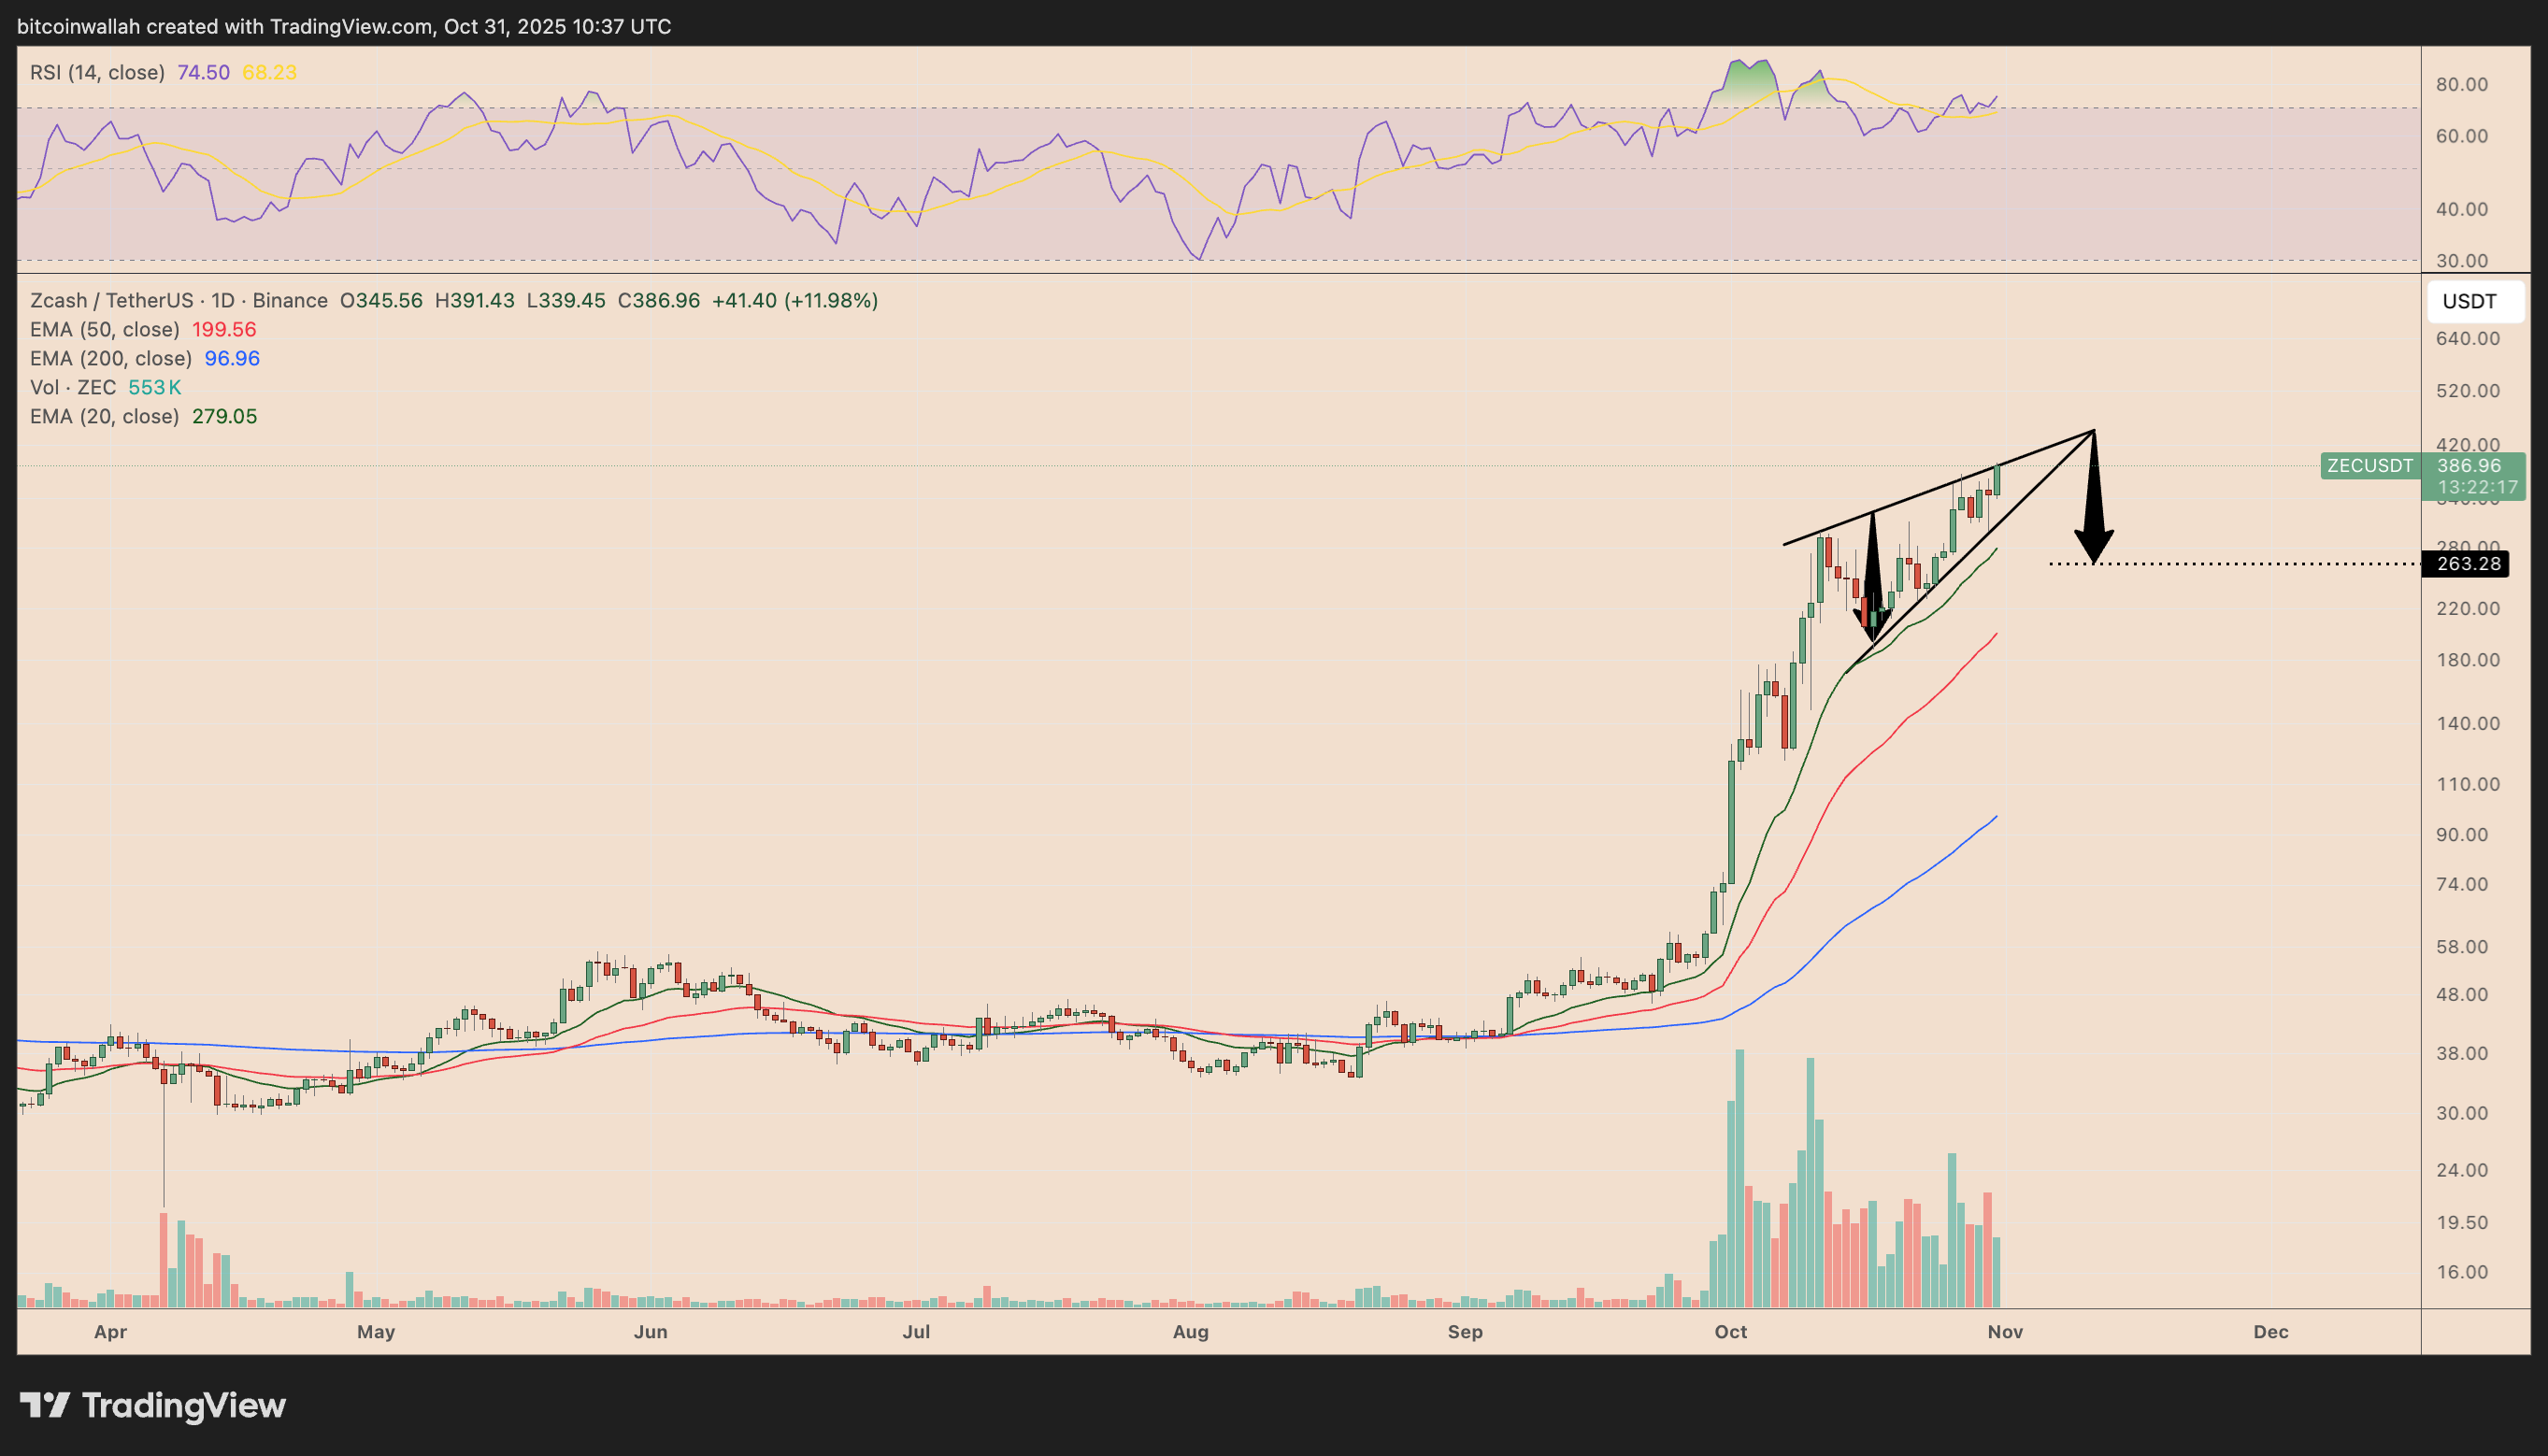 ZEC/USD daily price chart. Source: TradingView
However, bearish divergence between rising prices and declining RSI readings (now approximately 74) alongside diminishing trading volumes, suggests that buying pressure is weak. If sellers push ZEC below the wedge’s lower trendline, a 30% drop toward the $260–$270 region in November could materialize, aligning with the 20-day exponential moving average (EMA).
This article does not constitute investment advice. All investment and trading activities come with risks, and readers are urged to conduct thorough research before making any decisions.
