Ethereum Approaches Crucial Support Following a 15% Decline: Is This a Buy Signal?
Ethereum has experienced a significant drop recently, leading analysts to discuss whether it presents a buying opportunity or signals further declines.


Ethereum (ETH) has faced a sharp decline of 15% over the past week, moving closer to significant support levels near $3,500. With lower momentum and increasing trading volumes, analysts are divided about the implications of this drop—whether it can be seen as a buying opportunity or if it suggests more downturn is imminent.
Price Weakness as Momentum Decreases
Ethereum is currently trading at around $3,500 after a notable weekly decline and an immediate drop of 6%. The asset sees a trading range between $3,470 and $3,740 for the past 24 hours, while the 7-day peak hit about $4,150. At present, ETH is approximately 30% below its peak in August when it reached about $4,950.
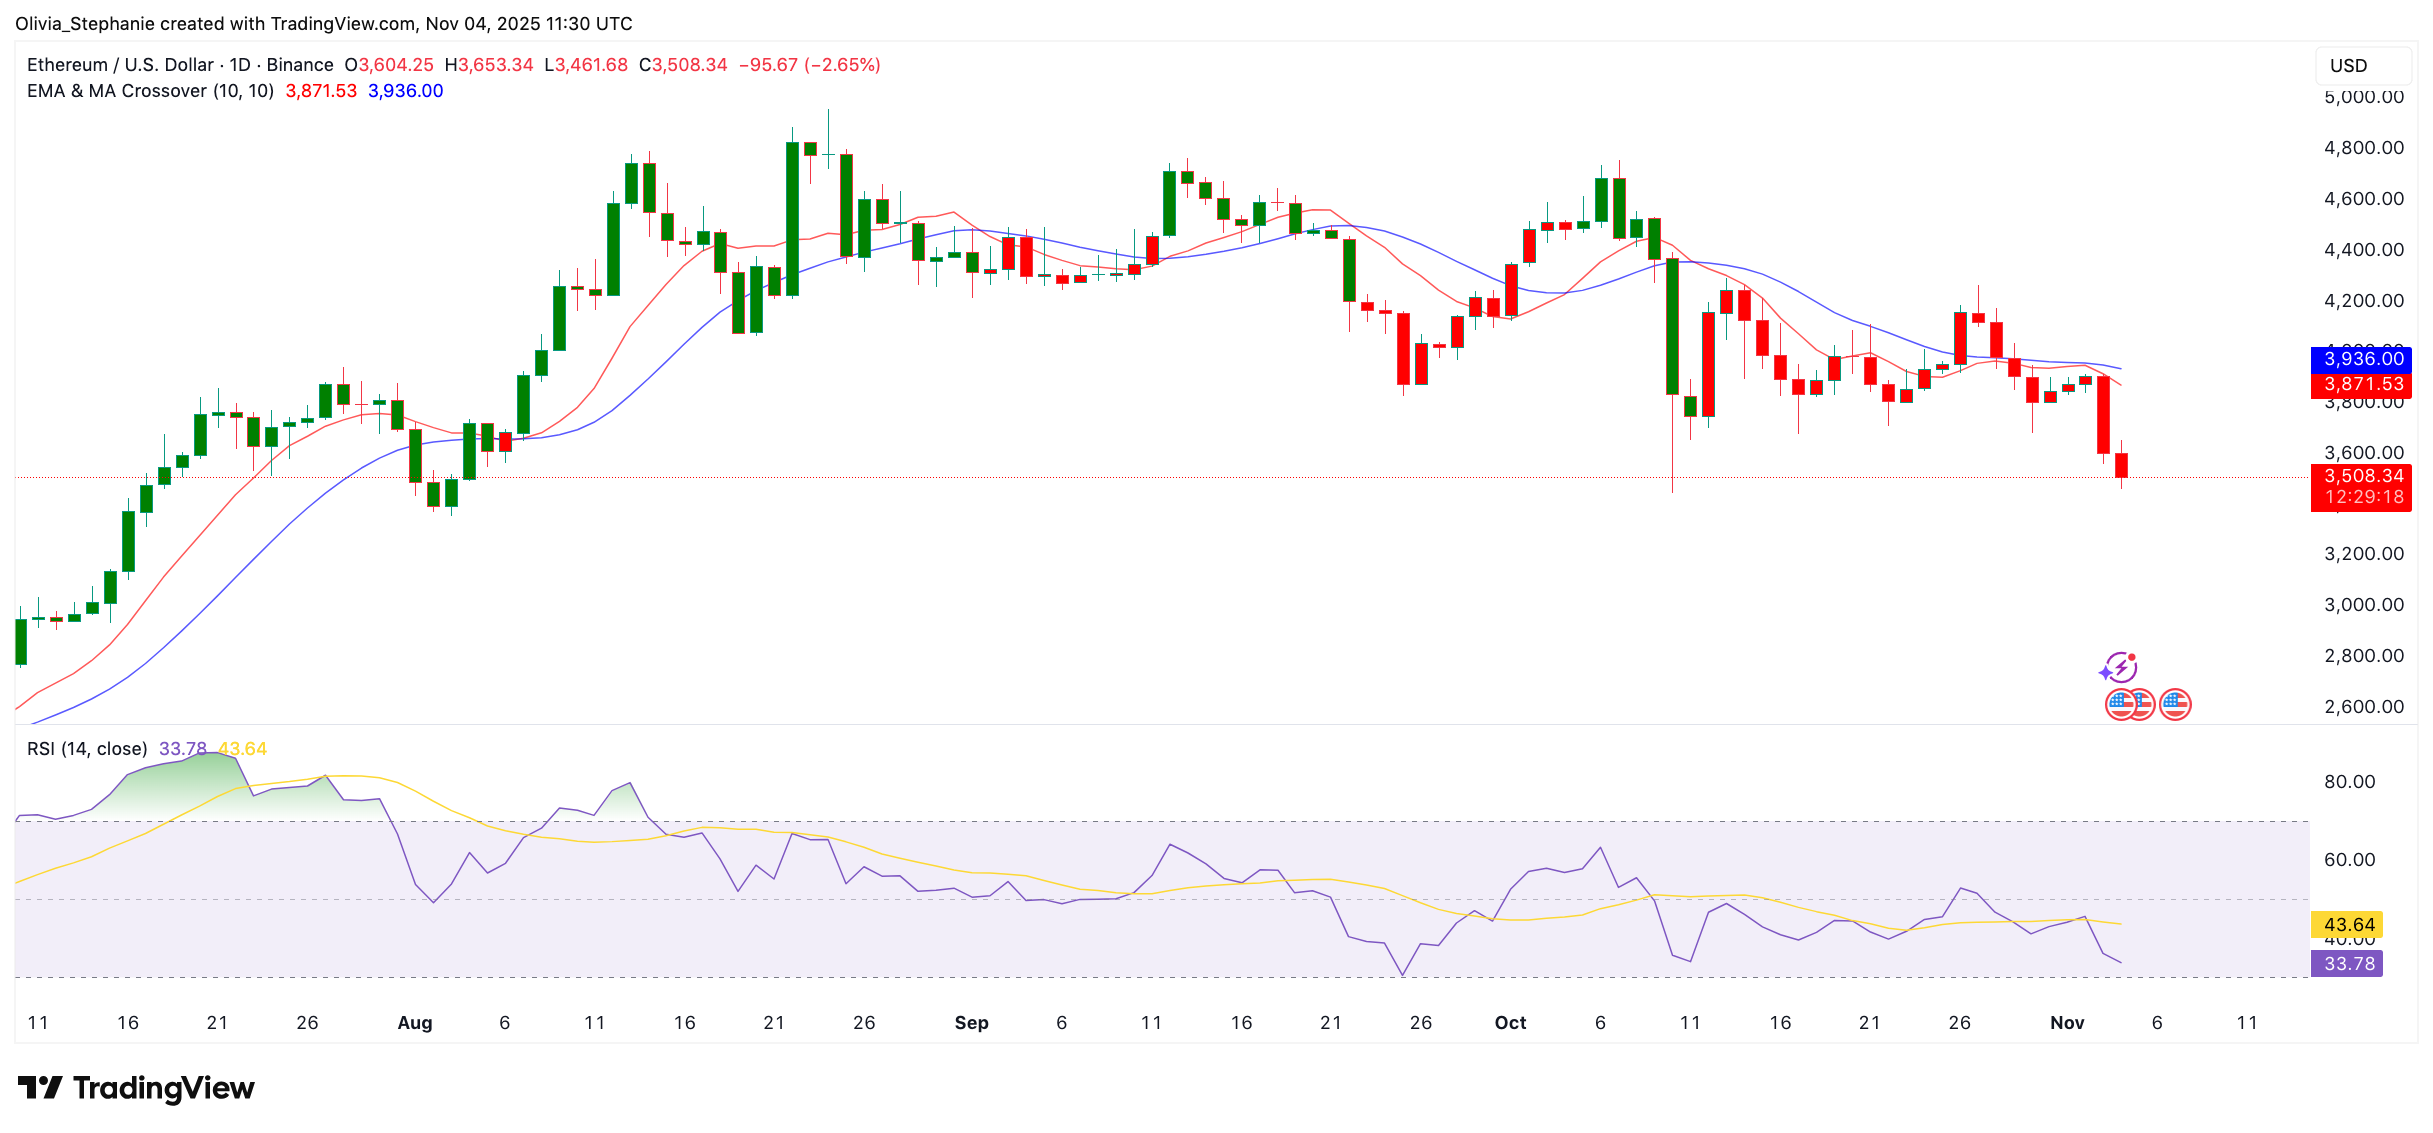
Interestingly, the Stochastic Oscillator indicates oversold conditions with both lines under 20—historically, such conditions have led to short-term recoveries. The Relative Strength Index (RSI) also supports this view, currently at 33.78, just above the oversold level of 30. As reported by crypto analyst Mister Crypto:
“$ETH is clearly oversold here. We usually bounce from this level. This time won’t be different.”
At this point, Ethereum has dipped below both its 10-day EMA ($3,871) and the 10-day MA ($3,936), confirming a weak price structure.
Ethereum Graph
Analyst Lennaert Snyder remarked, “$ETH rejected $3,900 resistance and dumped further,” noting that a dip below $3,360 could indicate a reversal zone for buying.
Some analysts are encouraging buying at these support levels. Specifically, Crypto Patel advised that this current movement could be the last opportunity.
“This is your LAST CHANCE to load up before the real run.”
They have pointed towards long-term price targets ranging between $10,000 and $15,000, despite current prices remaining well below these levels.
ETH/BTC Approaching Support
Ethereum is currently trading at 0.0339 BTC on the ETH/BTC chart. Michaël van de Poppe specified the 0.0325–0.035 BTC zone as a historical buying area, claiming ETH is “moving in the ideal area for buying opportunities.”
Moreover, that zone had previously acted as resistance but is now being retested, with the price staying above the 10-week moving average, strengthening the current support structure.
In a separate commentary, analyst Ali Martinez suggested that for ETH to maintain a bullish trend, it should remain above $3,800, overcome resistance at $4,900, and then target $8,000, while possibly encountering resistance near $5,600, $6,400, and $7,200.
