Is Bitcoin (BTC) Signaling Trouble? MACD Indicates Bearish Trend
Bitcoin experiences a significant price drop, influenced by a bearish MACD signal and tightening volatility below crucial support levels.


Bitcoin has recently fallen below critical technical levels, which has raised concern among traders and analysts. A bearish crossover on the three-week MACD, along with a decline in price, indicates weakening momentum as the asset struggles to maintain its position around $104,000.
MACD Cross Indicates Shift in Momentum
Crypto analyst Mister Crypto has noted that the three-week MACD has turned bearish, with the MACD line now falling below the signal line—a pattern that traders monitor closely for alterations in longer-term trend direction. Currently, Bitcoin trades at $103,850, experiencing a 3% decrease over the last 24 hours and a hefty 9% in the last week.
A comparable signal emerged in late 2021 before a significant drop in BTC’s price. The latest charts also demonstrate bearish divergence, with the asset reaching new highs while the MACD histogram recorded lower highs. According to Mister Crypto, this indicates yet another bearish signal for Bitcoin, reflecting a cautious sentiment across the market.
Bearish cross on the 3-week MACD. Another bearish signal for Bitcoin…
Image
— Mister Crypto (@misterrcrypto) November 4, 2025
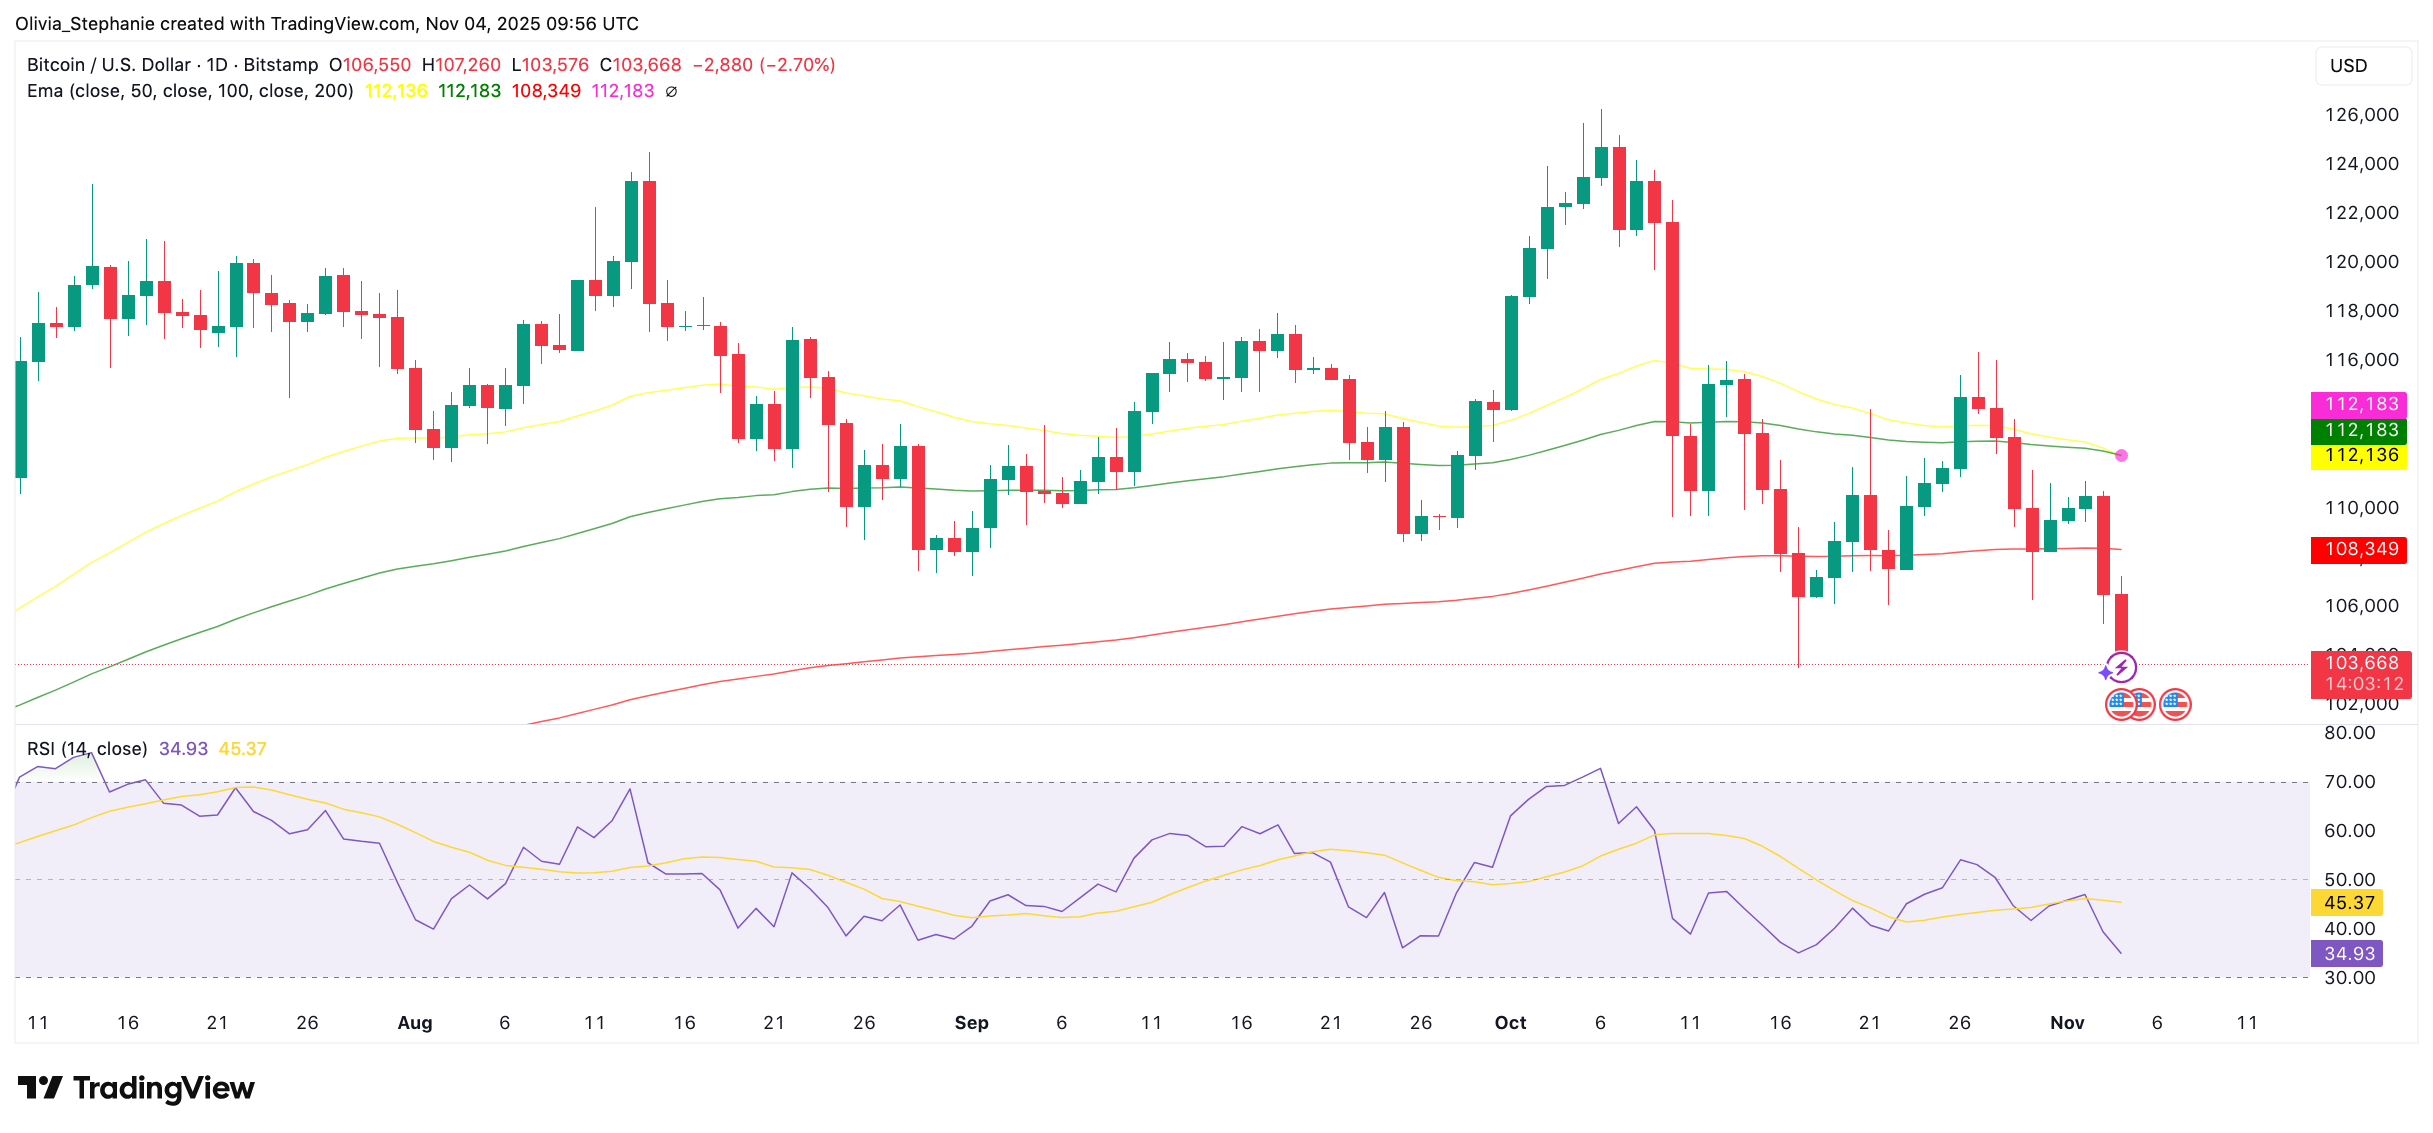
Additionally, Bitcoin is trading below its 50-day, 100-day, and 200-day exponential moving averages. The 50-day is set at $112,140, the 100-day at $108,350, and the 200-day at $112,180. The narrowing gap between the 50-day and 100-day averages suggests a potential crossover approaching. Maintaining price levels below these averages points to continued weakness in the trend.
Source: TradingView
Moreover, momentum indicators are also reflecting a lack of strength. The Relative Strength Index (RSI) has decreased to 35, nearing the oversold territory. The indicator remains beneath its signal line, suggesting continuous selling pressure. Traders often view this level as a potential area for a short-term reversal, contingent upon whether buying interest resurfaces.
Additional Insights
Recent analysis suggests that Bitcoin has regularly stayed above a critical technical support level during market corrections. Most recently, the price tested this support near $100,500 before showing a rebound. Closing the month below this level might indicate a shift in the trend.
Analyst Cryptoinsightuk commented that “liquidity is building between $91,000 and $98,000” and that “this type of structure is typically taken about 80% of the time.” They indicated that there is a “slightly more dense pocket above us around $102,000.” These zones are frequently targeted during significant price movements, particularly in algorithm-driven markets.
Attention on Key Support Around $100k
Analyst Ted Pillows cautioned that Bitcoin is “in absolute free fall,” stating, “There’s no strong support until the $100,000 level.” He identified the $92,000 region as the next possible target considering an open CME futures gap. Data from CryptoQuant showcases a decrease in US investor demand recently. Although self-custody activities have risen, early buying has not demonstrated robust follow-through, as noted by CryptoPotato. Analysts suspect that unless demand resumes, the risk for downside may stay high in the short term.
