Bitcoin Price Dynamics: Insights on BTC's Fluctuations Below $100K
An analysis of Bitcoin's current pricing trends as it dips below $100K, exploring market behaviors and potential recovery pathways.


Bitcoin has recently experienced a significant downturn, triggering a reduction in excess leverage as its price stabilizes within the $100K to $102K range, which is identified as a key accumulation zone. Despite lacking momentum in the short term, data from on-chain metrics and order flows indicate that institutional investors may be re-entering the market by taking advantage of retail panic and necessary liquidations.
Technical Analysis
The Daily Chart
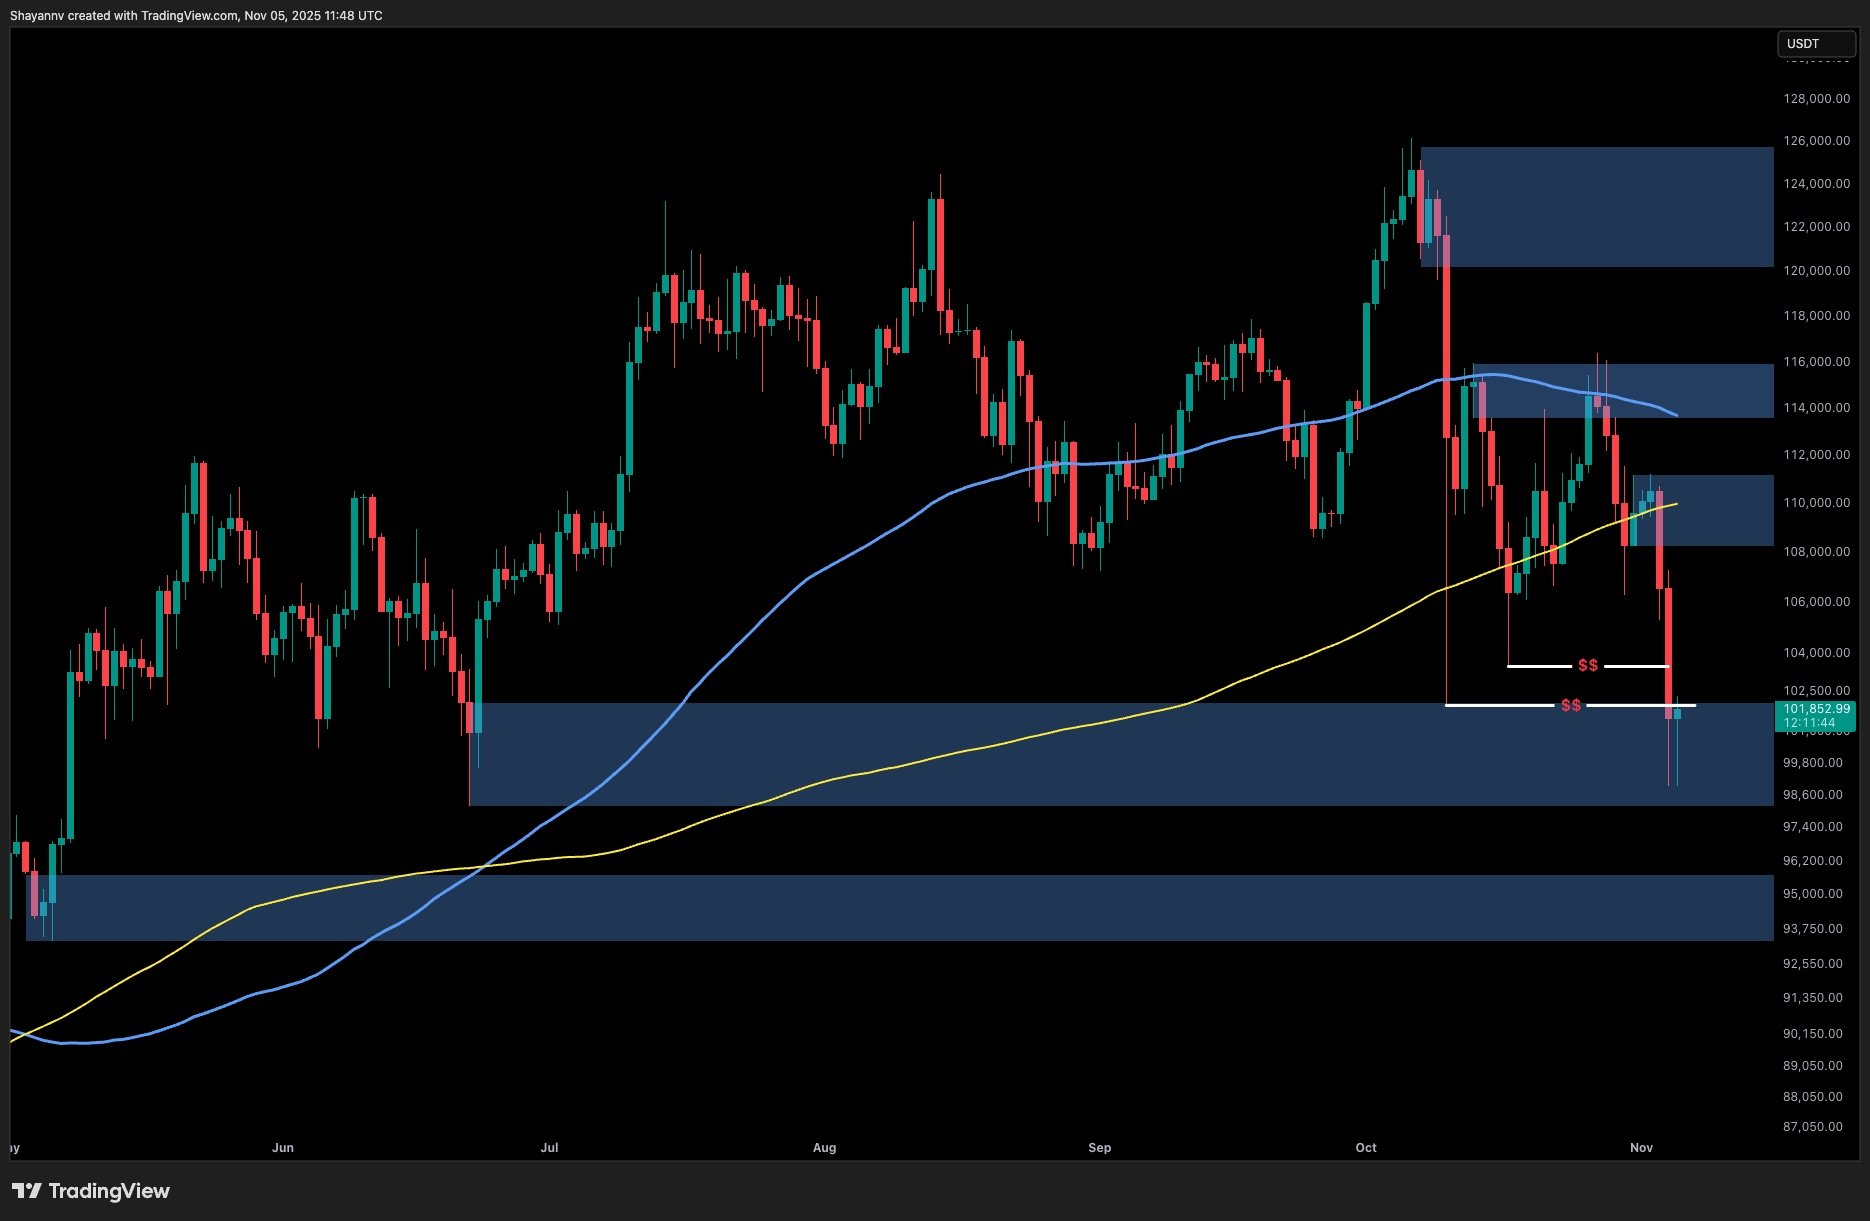
Bitcoin has fallen below both its 100-day and 200-day moving averages, suggesting a breakdown from its previous trading range. The resistance at $114K established a significant correction, leading BTC to tumble towards $101K, marking one of the most severe corrections since August. Currently, BTC is hovering over the $100K to $102K area, historically known as a critical support level that attracts institutional interest.
If BTC can consolidate and reclaim levels between $106K and $108K, it could signal that the recent price drop was merely a liquidity event, potentially setting the stage for recovery towards $114K - $116K. Conversely, failing to maintain support above $100K could lead the price down to a broader demand zone between $93K - $95K.
Bitcoin Daily Chart
The 4-Hour Chart
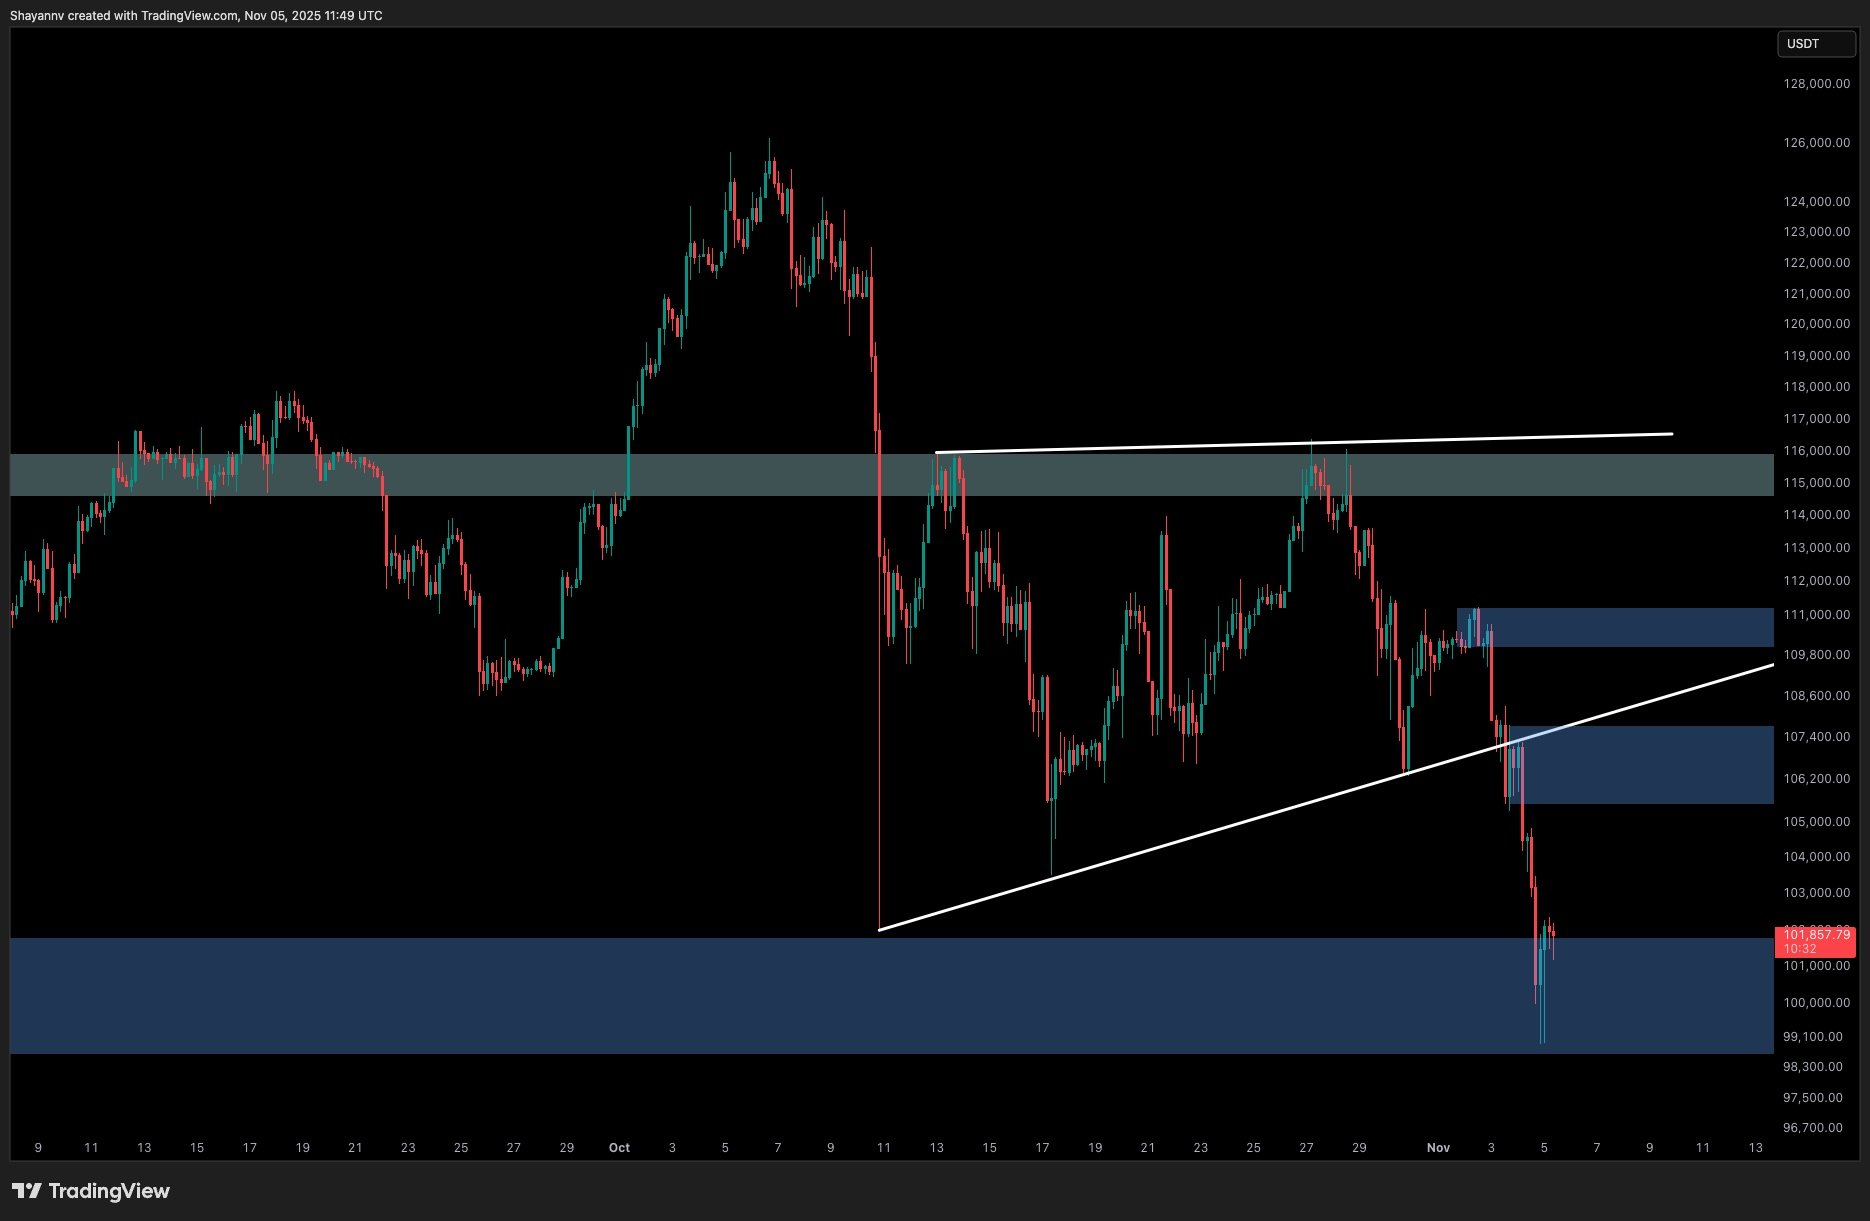
Recent activity on the 4-hour chart indicates a breakdown after Bitcoin formed an upward trend in late October, triggering a liquidation wave after breaching key support levels. Presently, it appears the market is stabilizing above the $100K demand region, with signs indicating that larger players might be accumulating amidst the retail panic.
Once again, a definitive retest of $106K as resistance must be reclaimed for a reliable bullish recovery.
 Bitcoin 4 Hour Chart
On-Chain Analysis
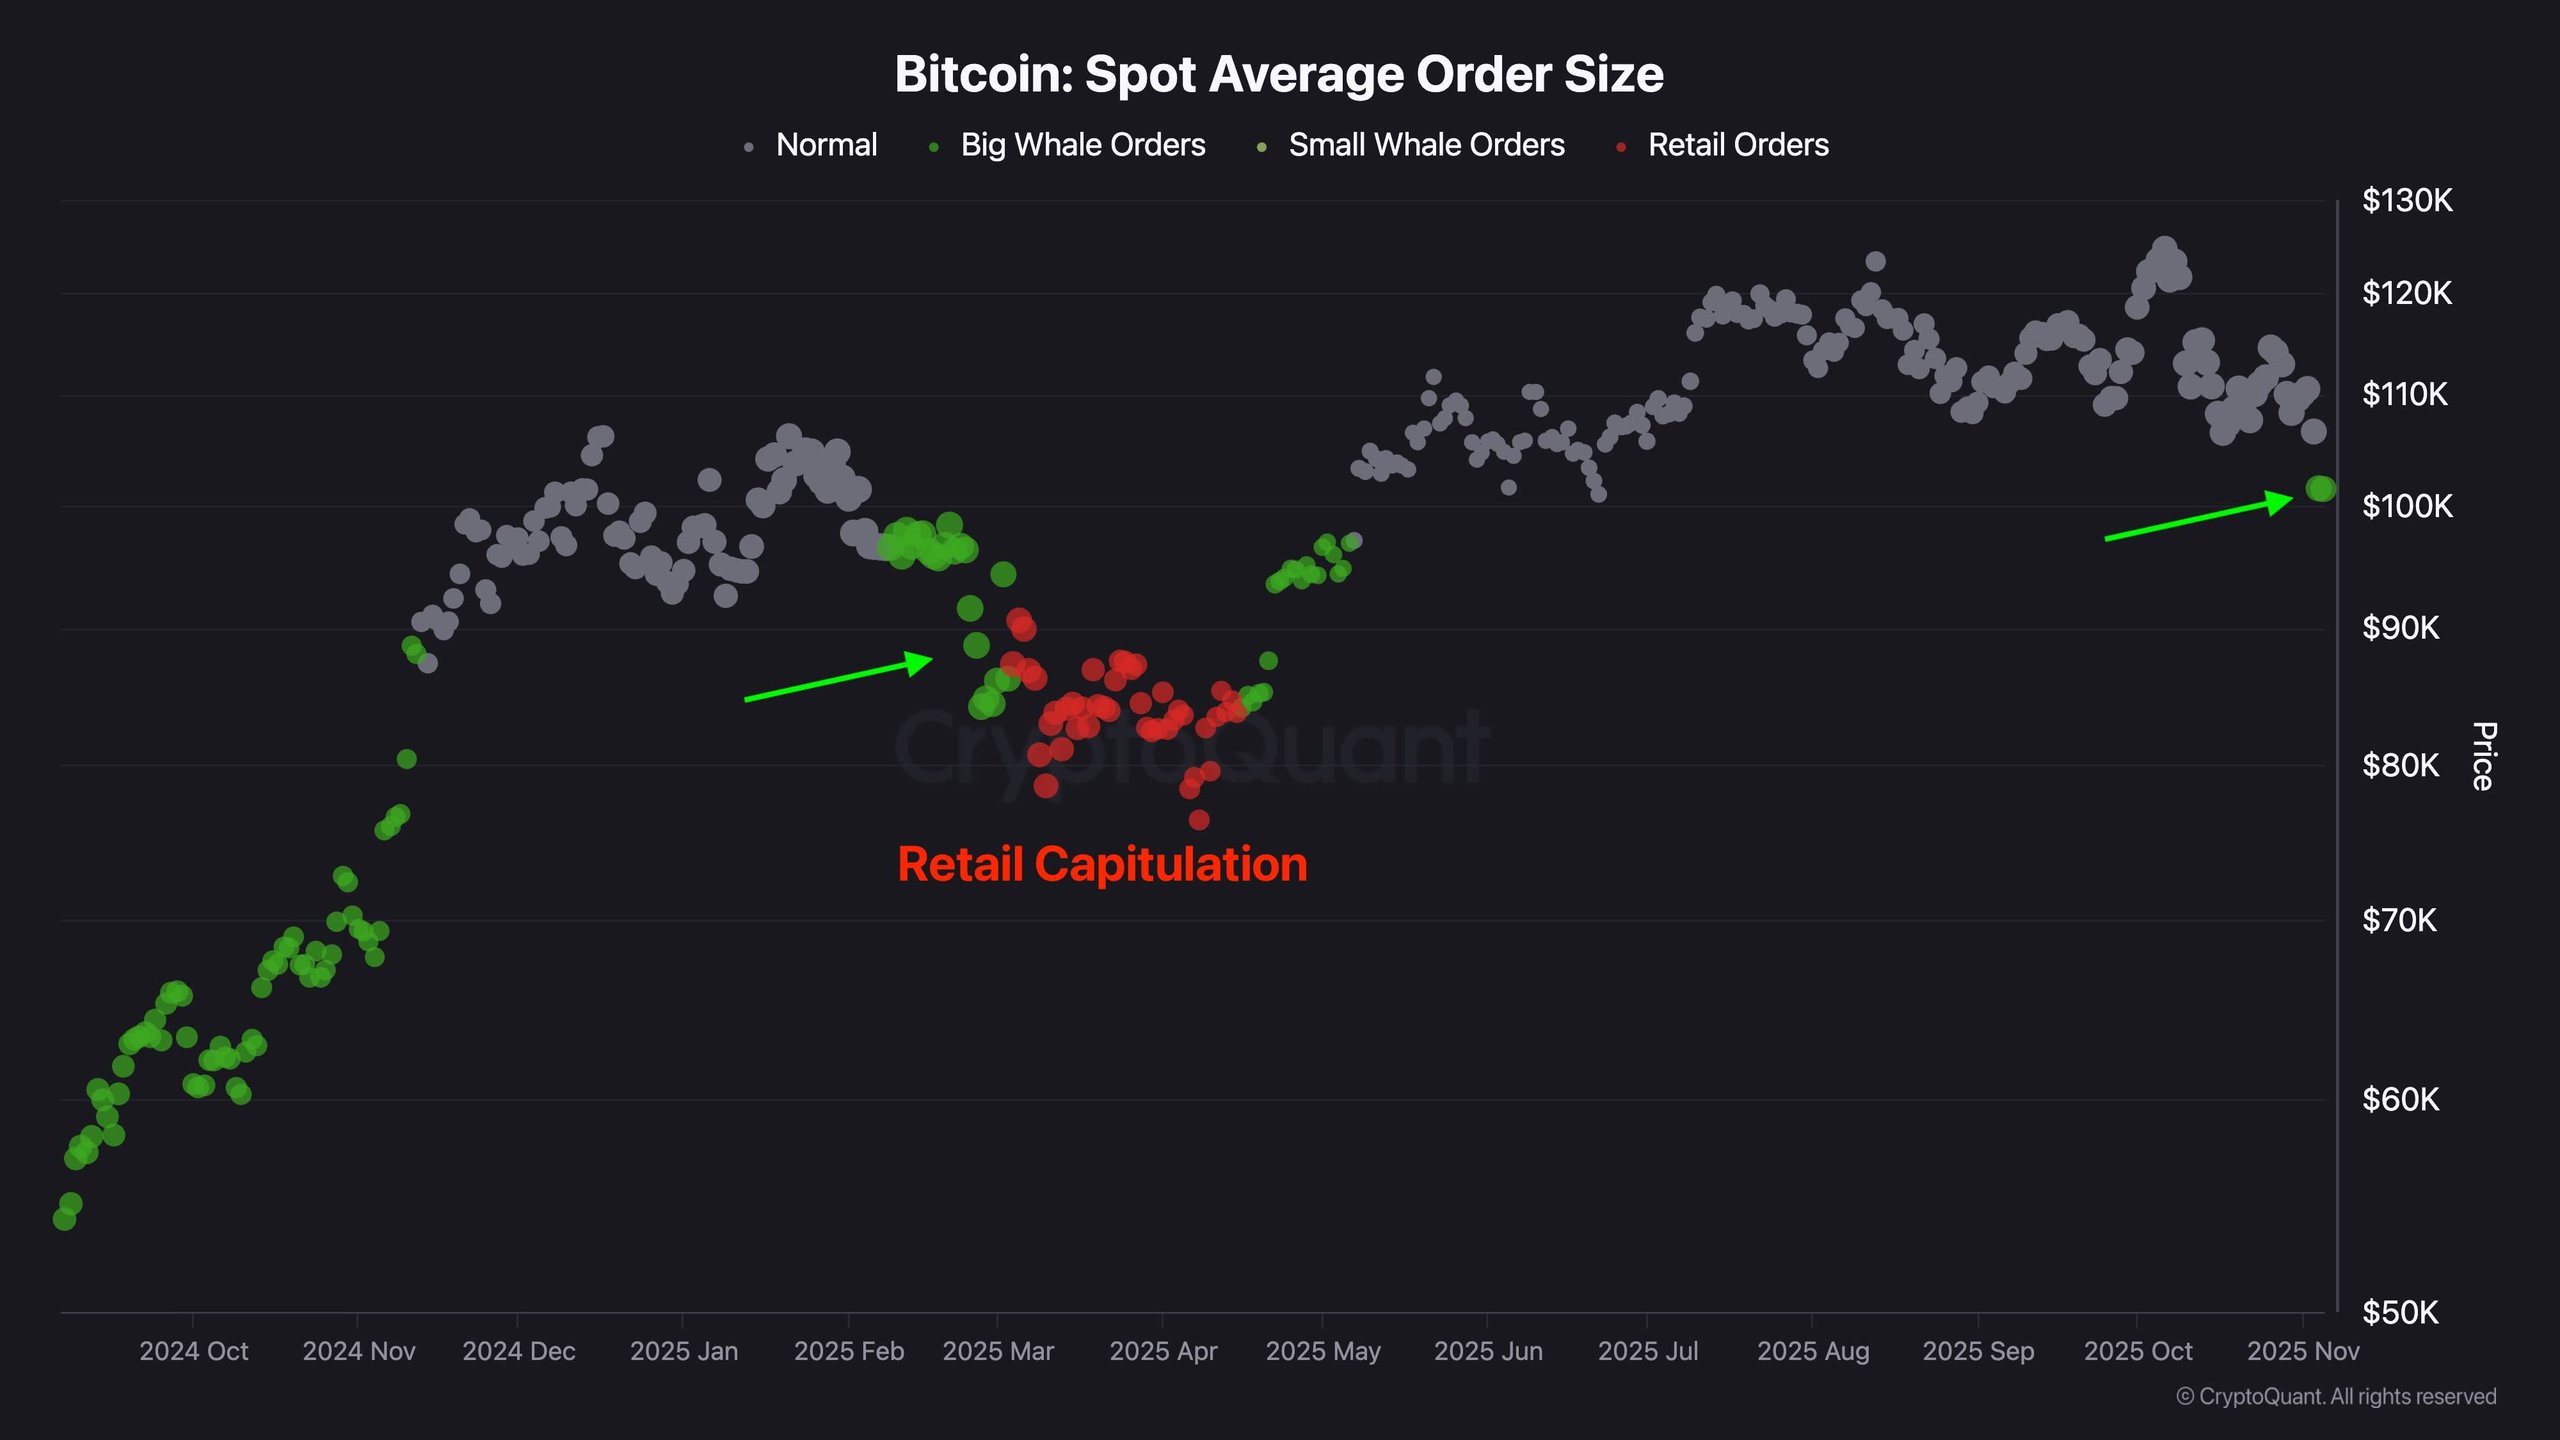
Recent shifts in the Bitcoin market revealed a rise in orders from larger investors. Following last year’s notable market decline, increased activity from institutional players has begun to appear again, noted by substantial order sizes in the vicinity of the $100K mark, hinting at potential institutional groundwork for future bull runs.
 Bitcoin Spot Average Order Size
Summary
The observed market patterns may signal a crucial precursor to a new bullish phase for Bitcoin, making it essential to monitor these key price levels moving forward.
