Is the Current Bitcoin Slide a Time to Panic or an Opportunity to Buy?
Bitcoin is trading near $100K following a recent drop, prompting analysts to watch for potential trends in recovery or further decline.


Bitcoin is currently hovering around $101,800 after experiencing a significant drop that brought it below its low from October 10th. This price level is under close scrutiny by market analysts as it coincides with a previous area of liquidity absorption.
With increased selling pressure and active market movements, this price point could critically influence Bitcoin’s trajectory.
Price Tests Liquidity Area Below October Crash
In the past seven days, Bitcoin has declined over 10% and is now trading just above $100,000, close to a crucial zone. Analyst Michaël van de Poppe remarked, “I am closely monitoring what occurs when Bitcoin takes liquidity from the crash on October 10th.” This situation could indicate a rebound or the onset of a bearish trend.
“I’m really keen to see what happens when #Bitcoin takes the liquidity from the October 10th crash. That should be a key point for potential bounces/bottom formations. Disastrous start of the month. $112K remains crucial for any new ATH attempts.” — Michaël van de Poppe @CryptoMichNL
Over the last 24 hours, the price fluctuated between $99,000 and $104,500 (according to CoinGecko). Its all-time high remains at $126,080, achieved 30 days prior. Van de Poppe suggested that a return to approximately $112,000 is necessary before serious discussions of new highs can take place.
Bullish Signals and Recovery Scenarios
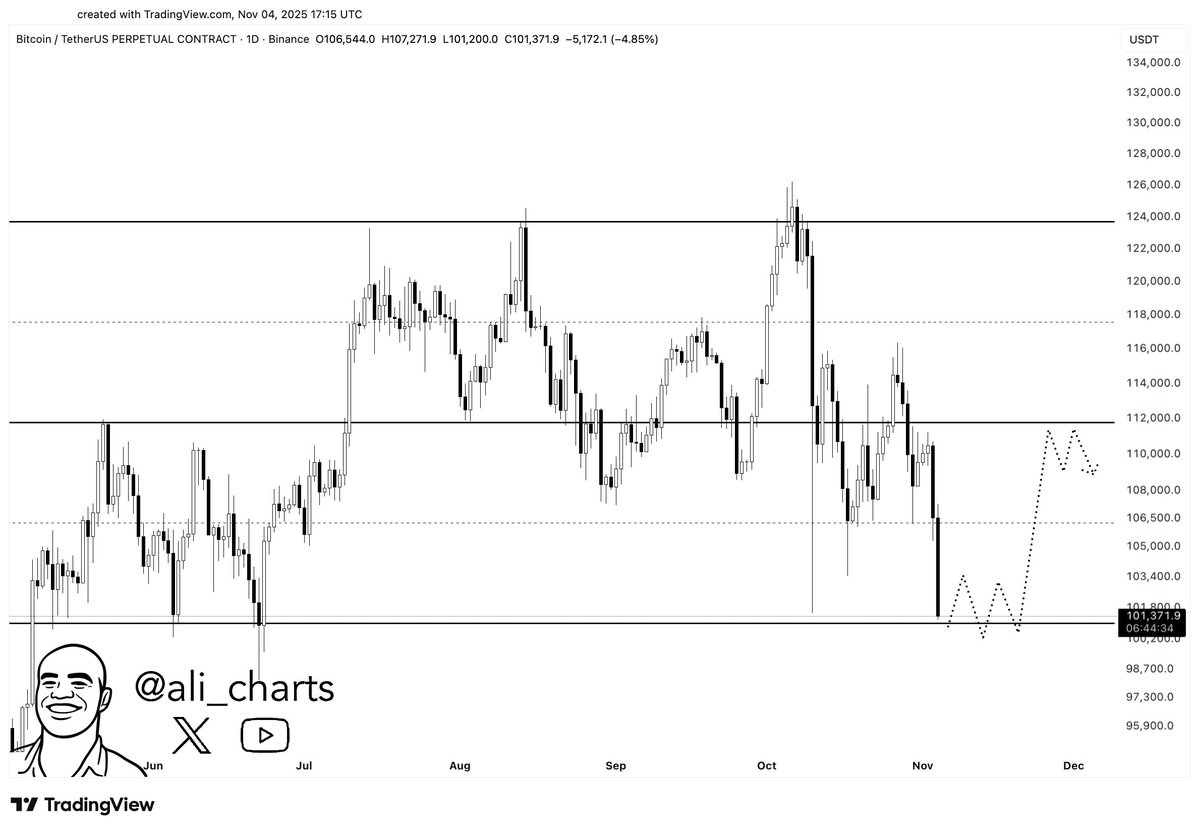
Analyst Ali Martinez noted, “Bitcoin could rebound here to at least $106,500 or $112,000.” The support zone surrounding $100,000 has historically acted as a stable base and may do so again if selling pressure diminishes. Based on his analysis, there are two likely outcomes: a quick rebound or a minor dip before recovery, with $106,500 identified as the first target.
Additional Insights
- Analyst CryptoBull_360 observed that Bitcoin has broken out of a previous ascending wedge pattern with robust volume while still trading above the 50-day moving average, which is serving as support.
“The price is anticipated to retest the breakout level; breaching below the 50-day moving average could incite further declines.” — CryptoBull_360
Bearish Pressure and Liquidity Risks Remain
However, not all indicators suggest an imminent recovery. Analyst Ted highlighted two large liquidity zones at $90,000 and $126,000, warning that “a dump to fill the CME gap prior to a reversal could occur.” The options market displays reduced movements, an indication that traders are uncertain and are currently exercising caution.
Recent reports also indicate that buying interest has not gained substantial momentum. Although self-custody has increased, buyers are not entering the market with sufficient volume. Additionally, the treasury firm Sequans Communications sold 970 BTC, reducing its holdings by nearly one-third to alleviate debts of $189 million, bringing them down to approximately $94.5 million.
Thus far, the price range between $100,000 and $102,000 has held steady, but pressure persists. Whale wallets recently offloaded $272 million worth of Bitcoin. If this trend continues, bulls may struggle to uphold current price levels.
The $112,000 threshold remains essential for any more extensive recovery. Until this point is regained, Bitcoin may remain in a holding pattern.
