Bitcoin Price Analysis: Forecasting Support Levels Beyond $100K
An analysis of Bitcoin's recent price drop below the $100K threshold and potential future support levels.


Bitcoin’s price has recently dipped below the pivotal $100K mark, indicating a bearish trend. If buying interest fails to maintain this key level, a further decline toward $95K is likely.
Technical Insights
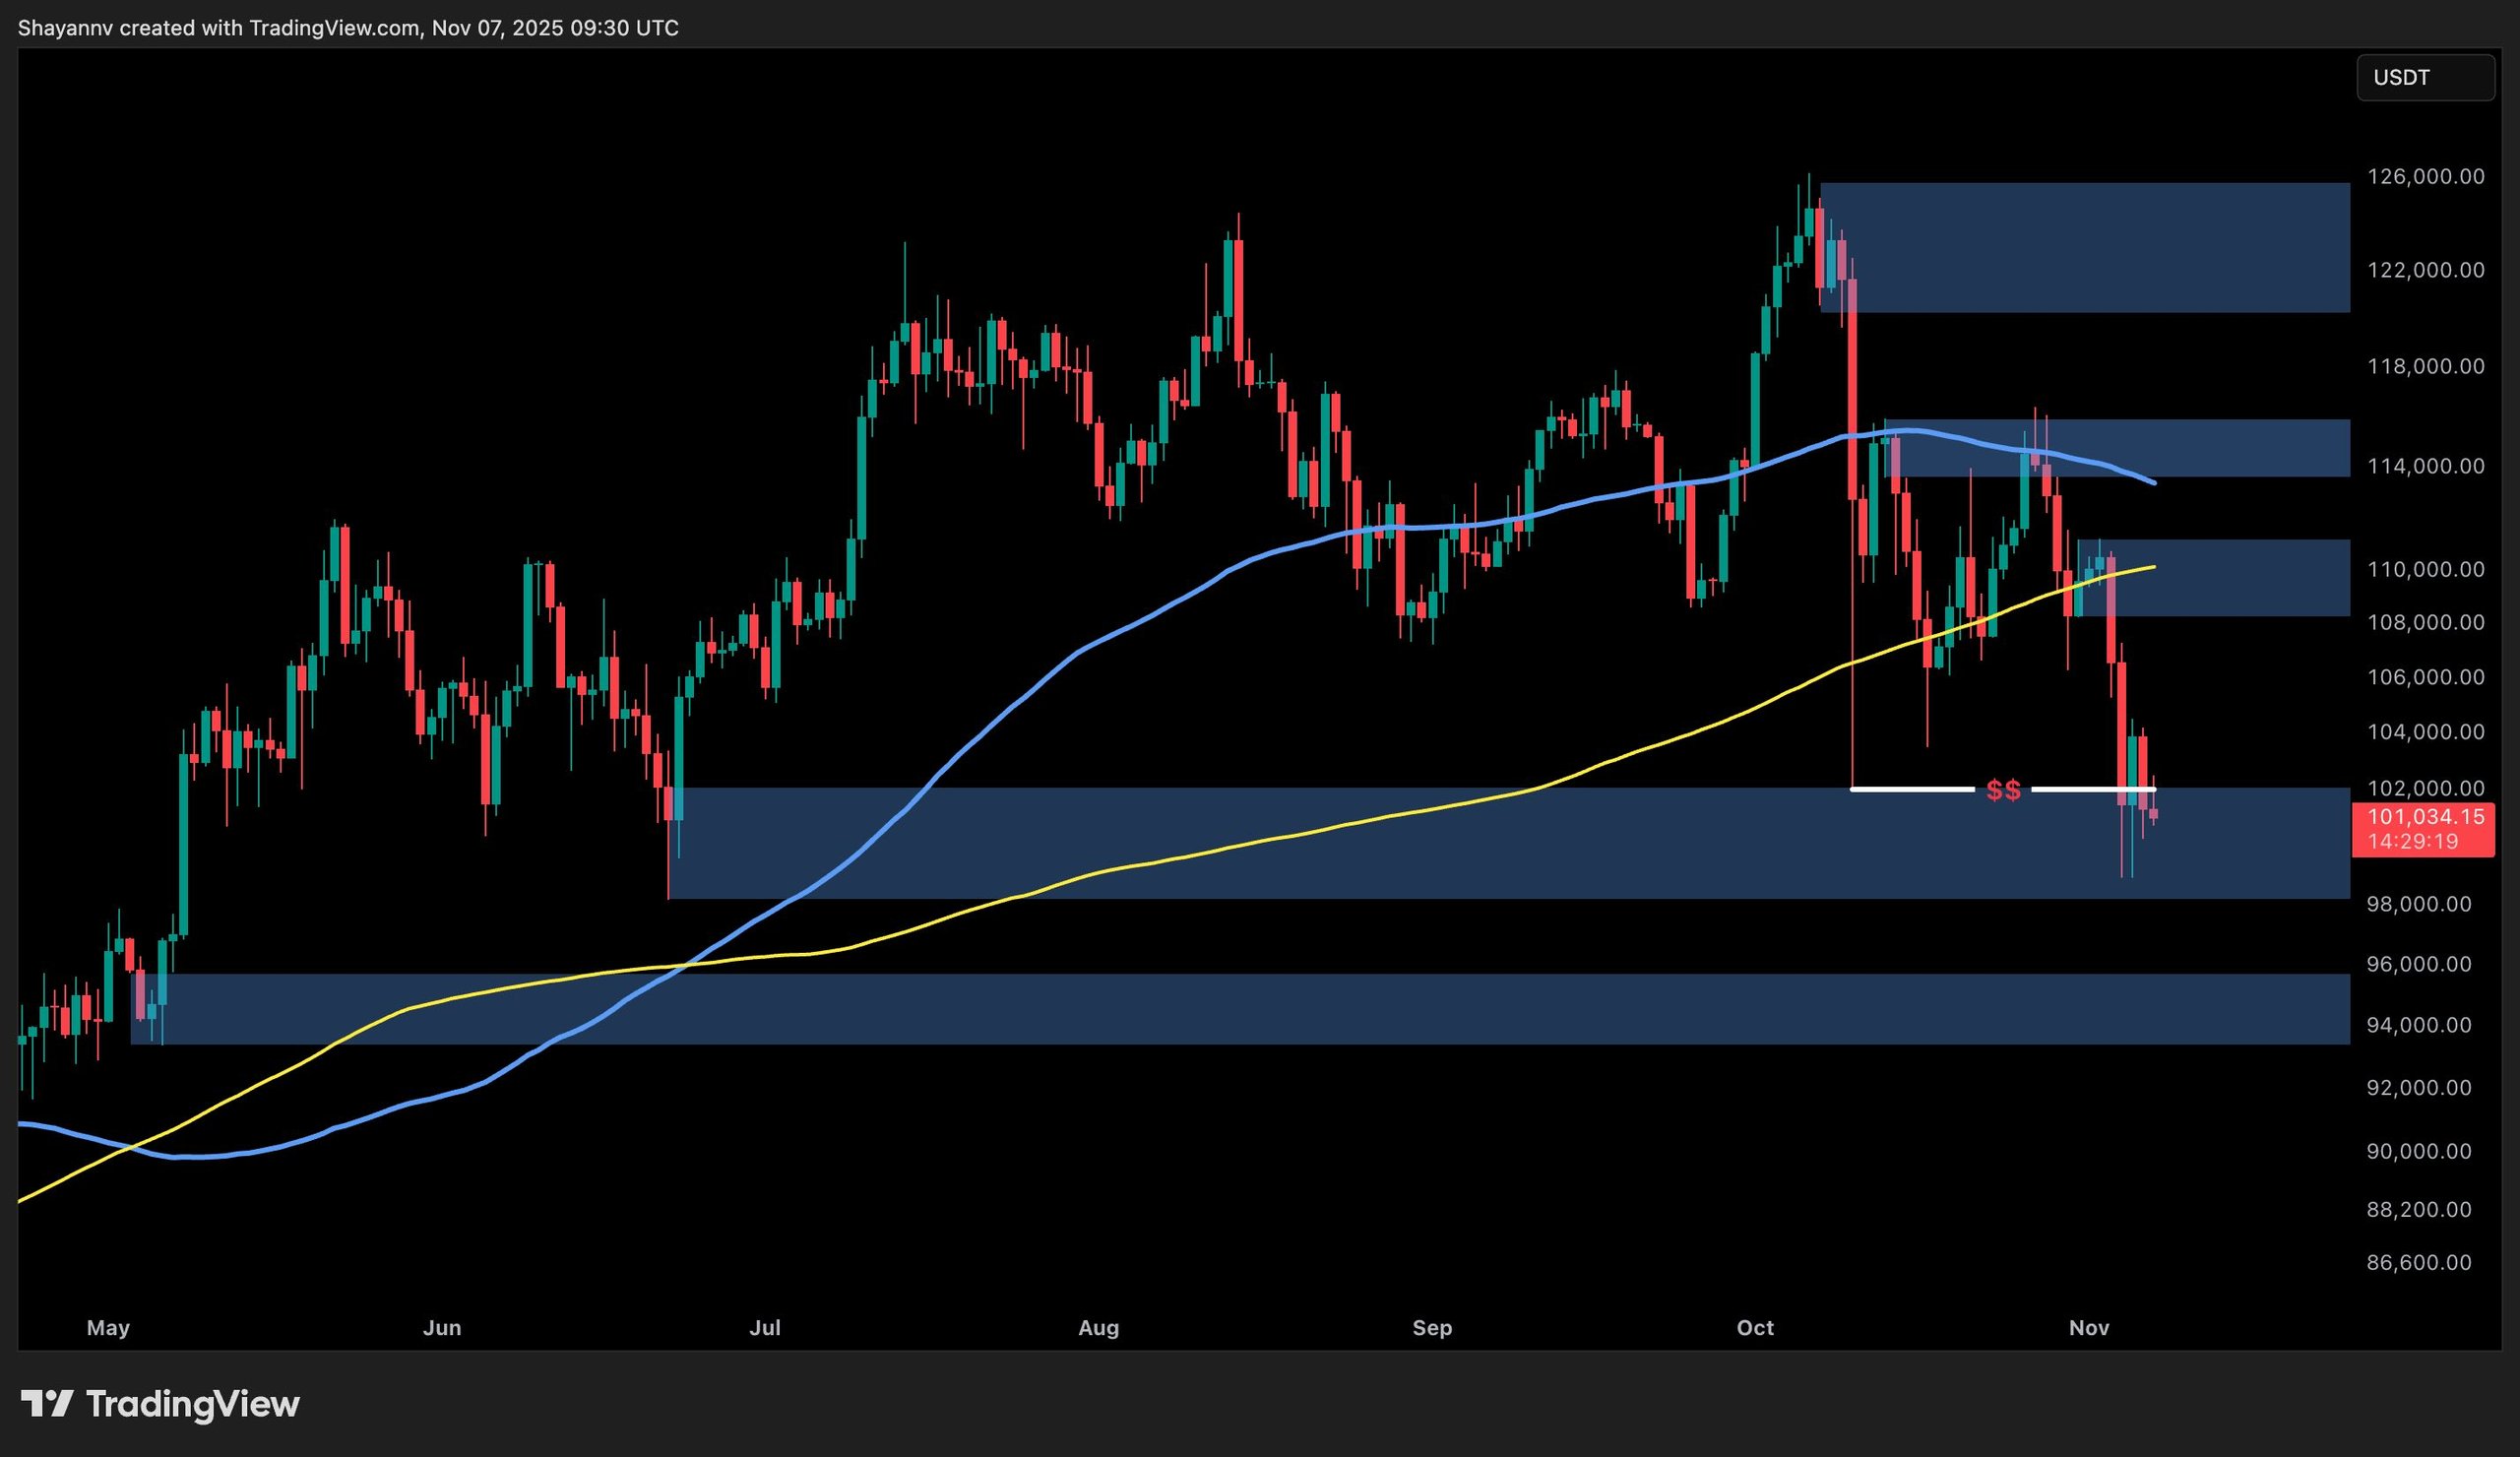
- Daily Analysis: Currently, Bitcoin is trading between the $100K–$102K demand zone and the $114K resistance mark, with both the 100-day and 200-day moving averages acting as barriers.
- A recent falter from the 100-day moving average (approximately $110K) resulted in a pullback to the $101K support level, completing a liquidity sweep at the previous low.
- The price is stabilizing within a historically high-volume node, a place where past macro corrections often rebound. Recent lows suggest liquidity beneath $100K has been tapped, indicating that, if sustained, this could signal consolidation and a higher low to follow.
For bullish sentiment, reclaiming the $106K–$108K range would signal strength, while bears could gain control with a daily close under $99K, turning attention to the $93K–$95K accumulation zone.
Daily Chart
Four-Hour Analysis
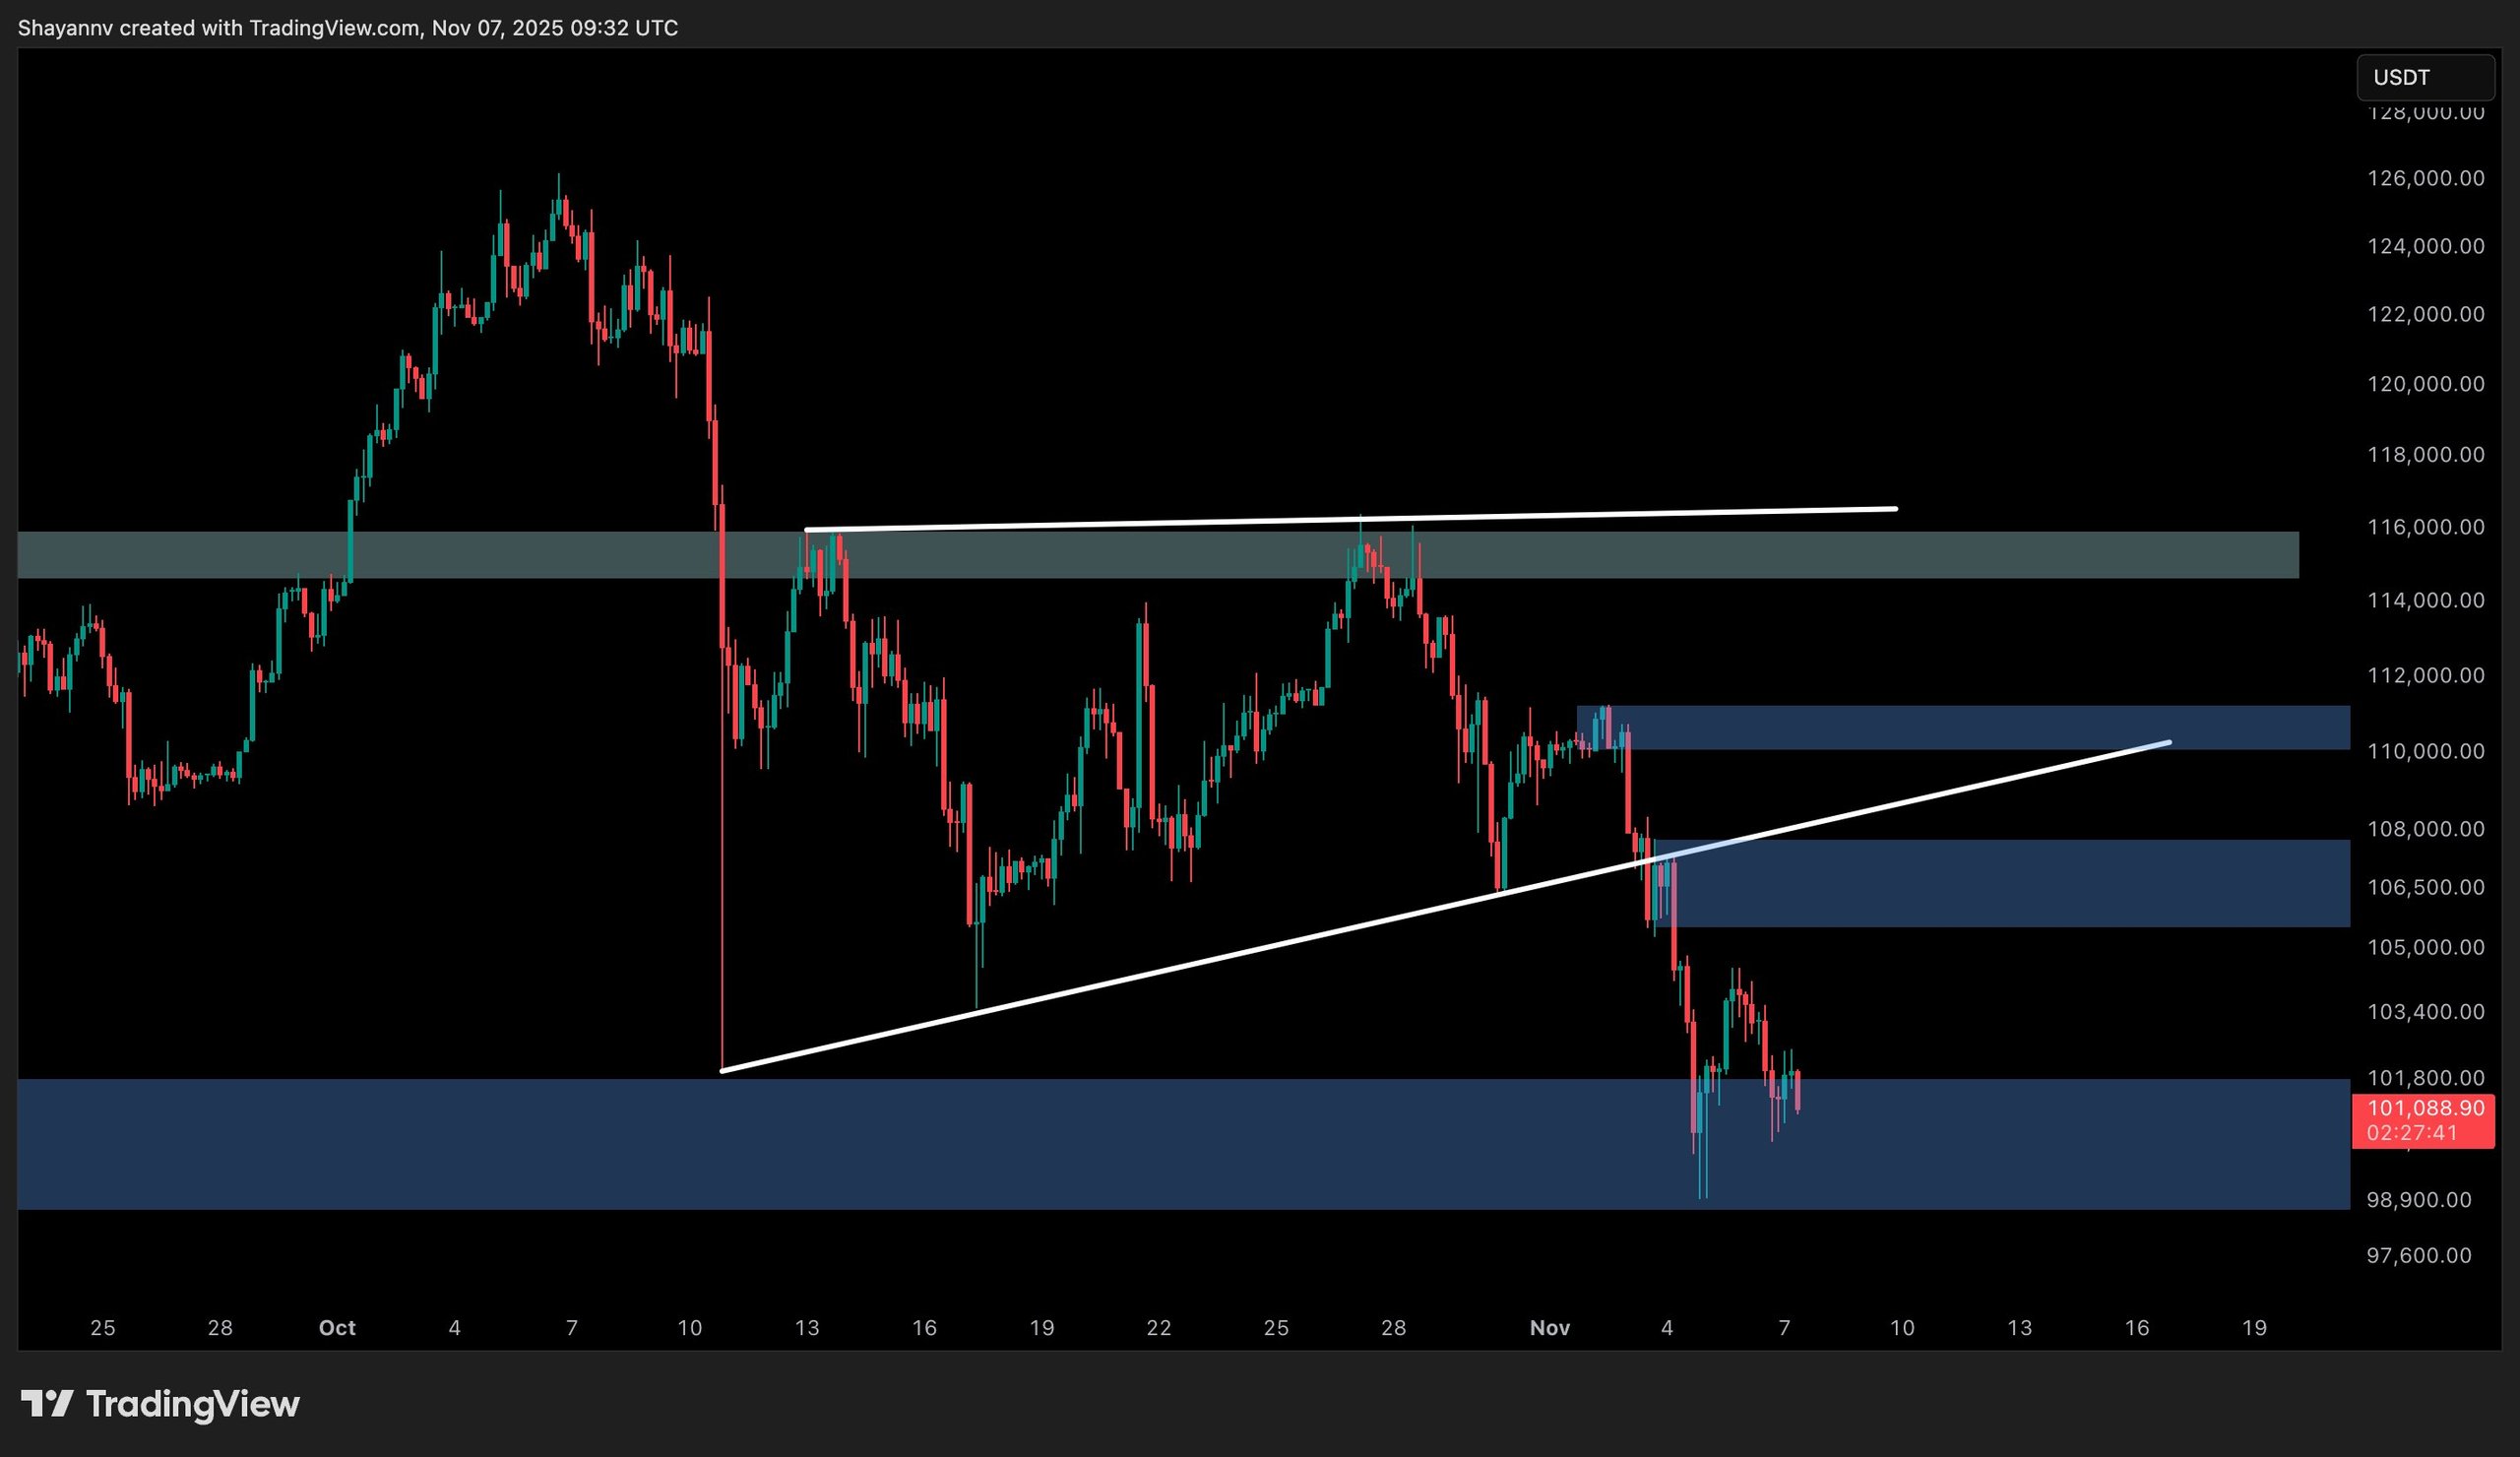
The 4-hour chart indicates a contracting descending range, where lower highs are being formed closer to support—an indicator of momentum fading.
Repeated tests around the $101K–$102K mark have created demand pockets above $106K and $110K, possibly serving as magnets for corrective rallies in the future. Such behavior is customary as leveraged positions are neutralized and volatility diminishes.
Should prices reclaim the $106K pivot, short-term upside toward $110K is plausible. However, consistent rejections from $104K could prolong the accumulation phase until mid-November.
 4-Hour Chart
On-Chain Observations
The Realized Price by UTXO Age Bands highlights the present supply-demand equilibrium. Bitcoin’s price dip has brought it below previously held support levels for 1–3 month and 3–6 month holders, indicating a collective loss for these groups. This transition redefines their realized prices (around $107K–$110K) as new overhead supply zones.
In contrast, the realized price for the 6–12 month cohort is hovering near $95K–$96K, emerging as a potential support threshold. This more patient group historically absorbs supply during downturns, offering market support.
This distribution creates a structural context; Bitcoin is navigating between realized supply from short-term holders and demand from mid-term investors. Maintaining a level above this realized price band indicates that long-term capital continues to stabilize the market, maintaining the overall bullish sentiment intact. However, if there’s a significant drop below this level, we might see a deeper capitulation before any substantial recovery occurs.
 On-Chain Analysis
Disclaimer: The information presented here reflects views of analysts and not a financial advice. Users should conduct their own research before making any trading decisions.
