Ethereum Price Review: Essential Resistance Still Blocks ETH's Path to $4K
Ethereum's recent price movements indicate a possible market recovery as it bounces back from key support levels.


Ethereum has bounced back from the $3.2K range following a significant liquidity sweep, which indicates that the recent downward trend may be losing momentum. Despite strong short-term resistance, indicators in both technical analysis and on-chain data point towards a potential accumulation phase driven by larger investors.
Technical Assessment
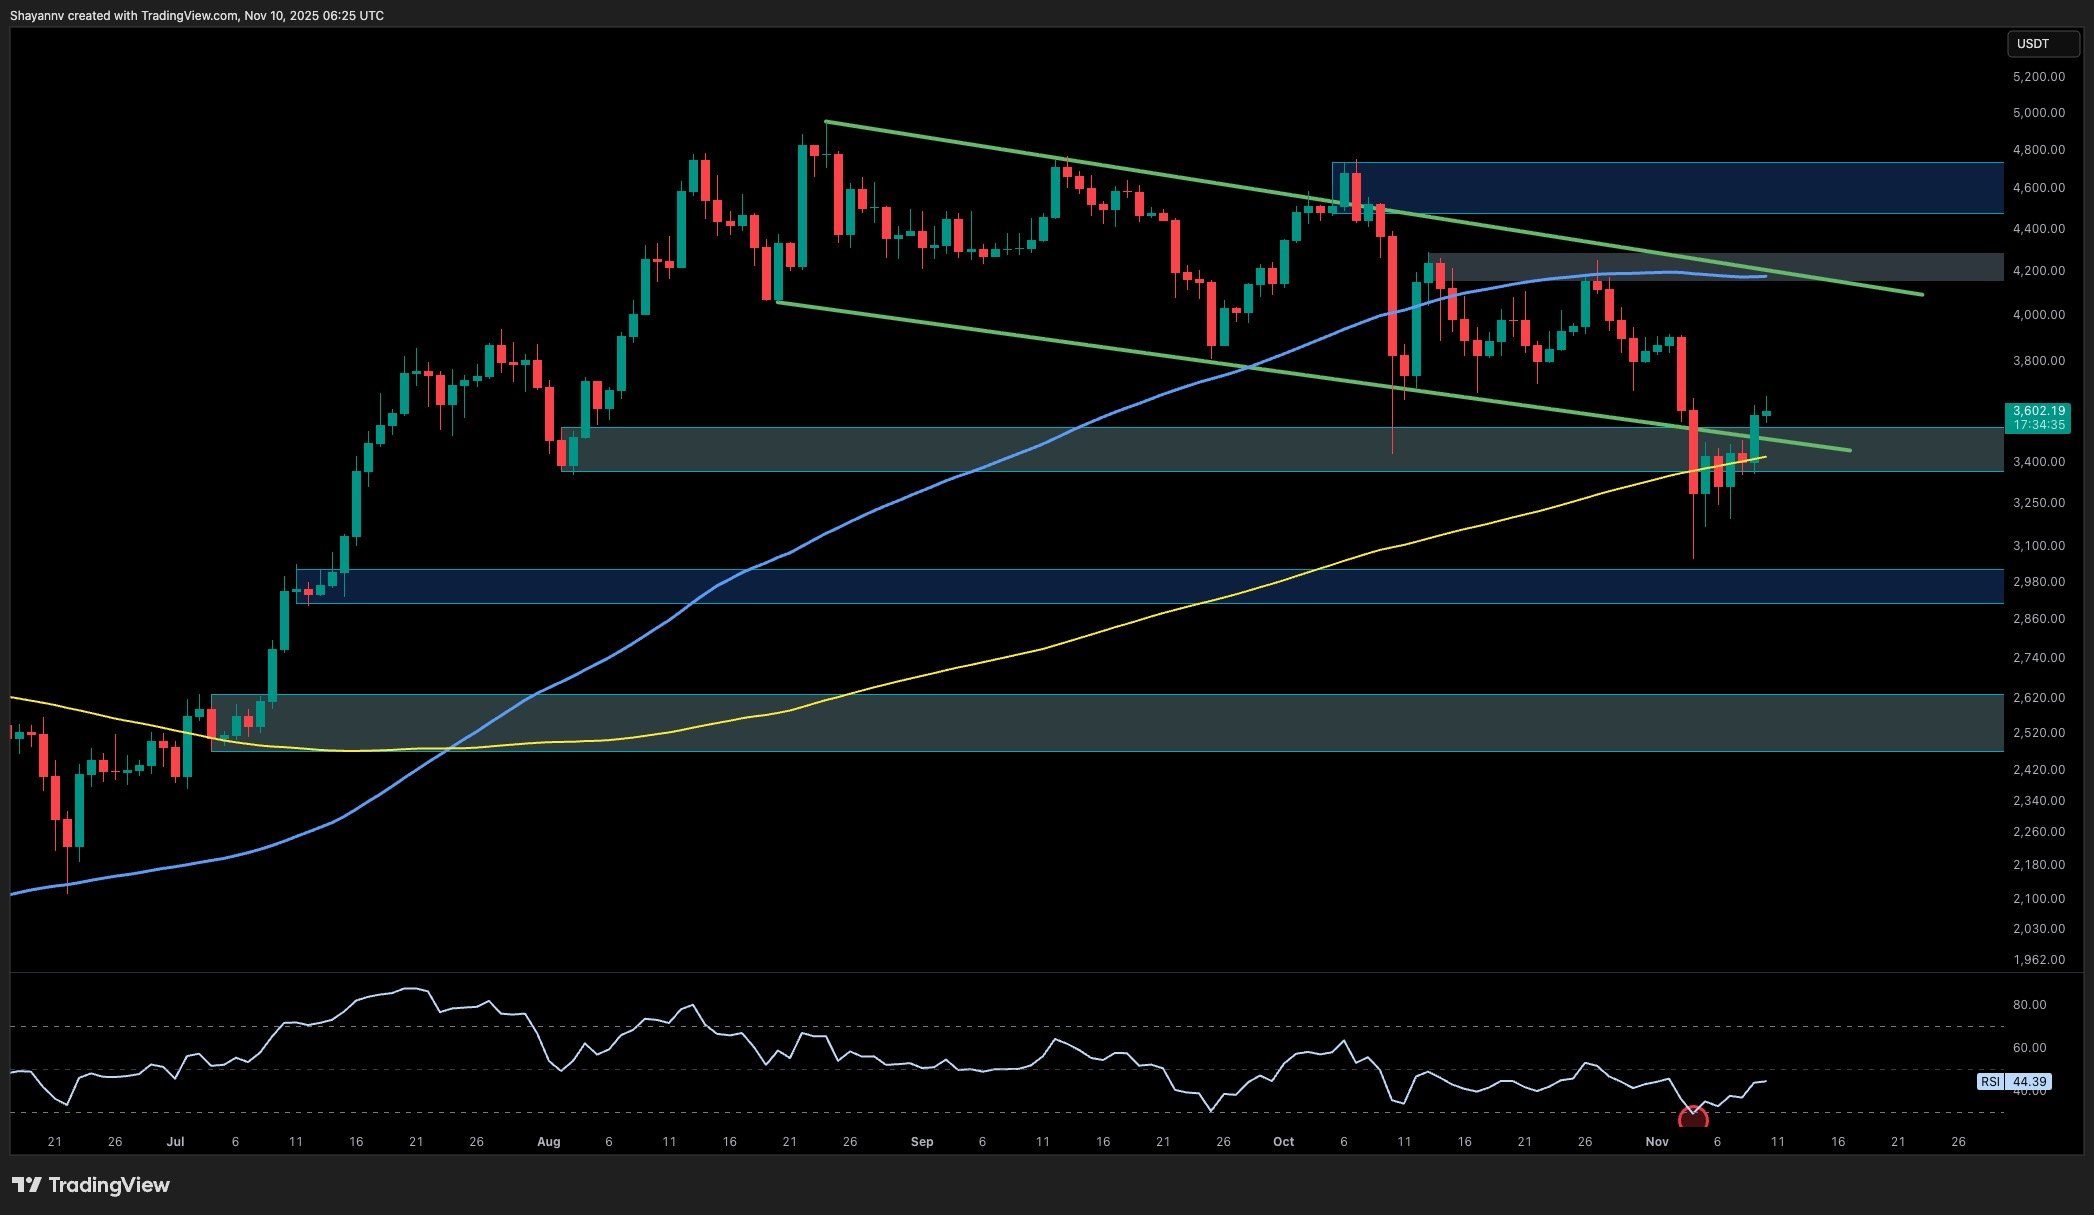
On the daily chart, ETH has notably rebounded from the crucial $3K–$3.2K support zone, which aligns with the lower trendline of the channel and the 200-day moving average (MA). This convergence zone has proven robust, leading to the creation of a long lower wick on the price chart, signifying liquidity absorption by stronger market participants.
A recent attempt to breach the descending parallel channel has emerged as the first positive signal since mid-October. Ethereum is presently re-evaluating the resistance area around $3.6K–$3.7K, positioned at the intersection of the channel’s midline and key institutional decision points.
If buyers succeed in closing above this range, it would likely confirm a significant structural shift, paving the way for a further rise toward $3.9K–$4.0K, followed by an area of high liquidity near $4.4K. However, failing to maintain support above $3.6K could lead to a short-term re-examination of the $3K region, which is now regarded as a primary support level.
ETH Daily Chart
4-Hour Chart Analysis
The 4-hour analysis reveals a detailed setup concerning a bear trap. Following a substantial downturn below $3.3K, Ethereum briefly dipped into the $3K liquidity zone, sweeping earlier lows before rebounding sharply. This quick recovery invalidated negative momentum and initiated a reversal period.
Currently, prices are consolidating just under the $3.6K–$3.7K “Seller’s Base,” deemed the last untouched supply area preceding previous declines. A successful breakout and retest of this base could confirm a transition of market control back to buyers. Until then, ETH is expected to fluctuate between $3.4K and $3.7K, establishing a foundation before the next upward movement.
RSI momentum lends credence to this scenario; it has recently broken out from a long-standing bearish divergence trend, steadily rising and suggesting that further recovery is achievable should the structure hold.
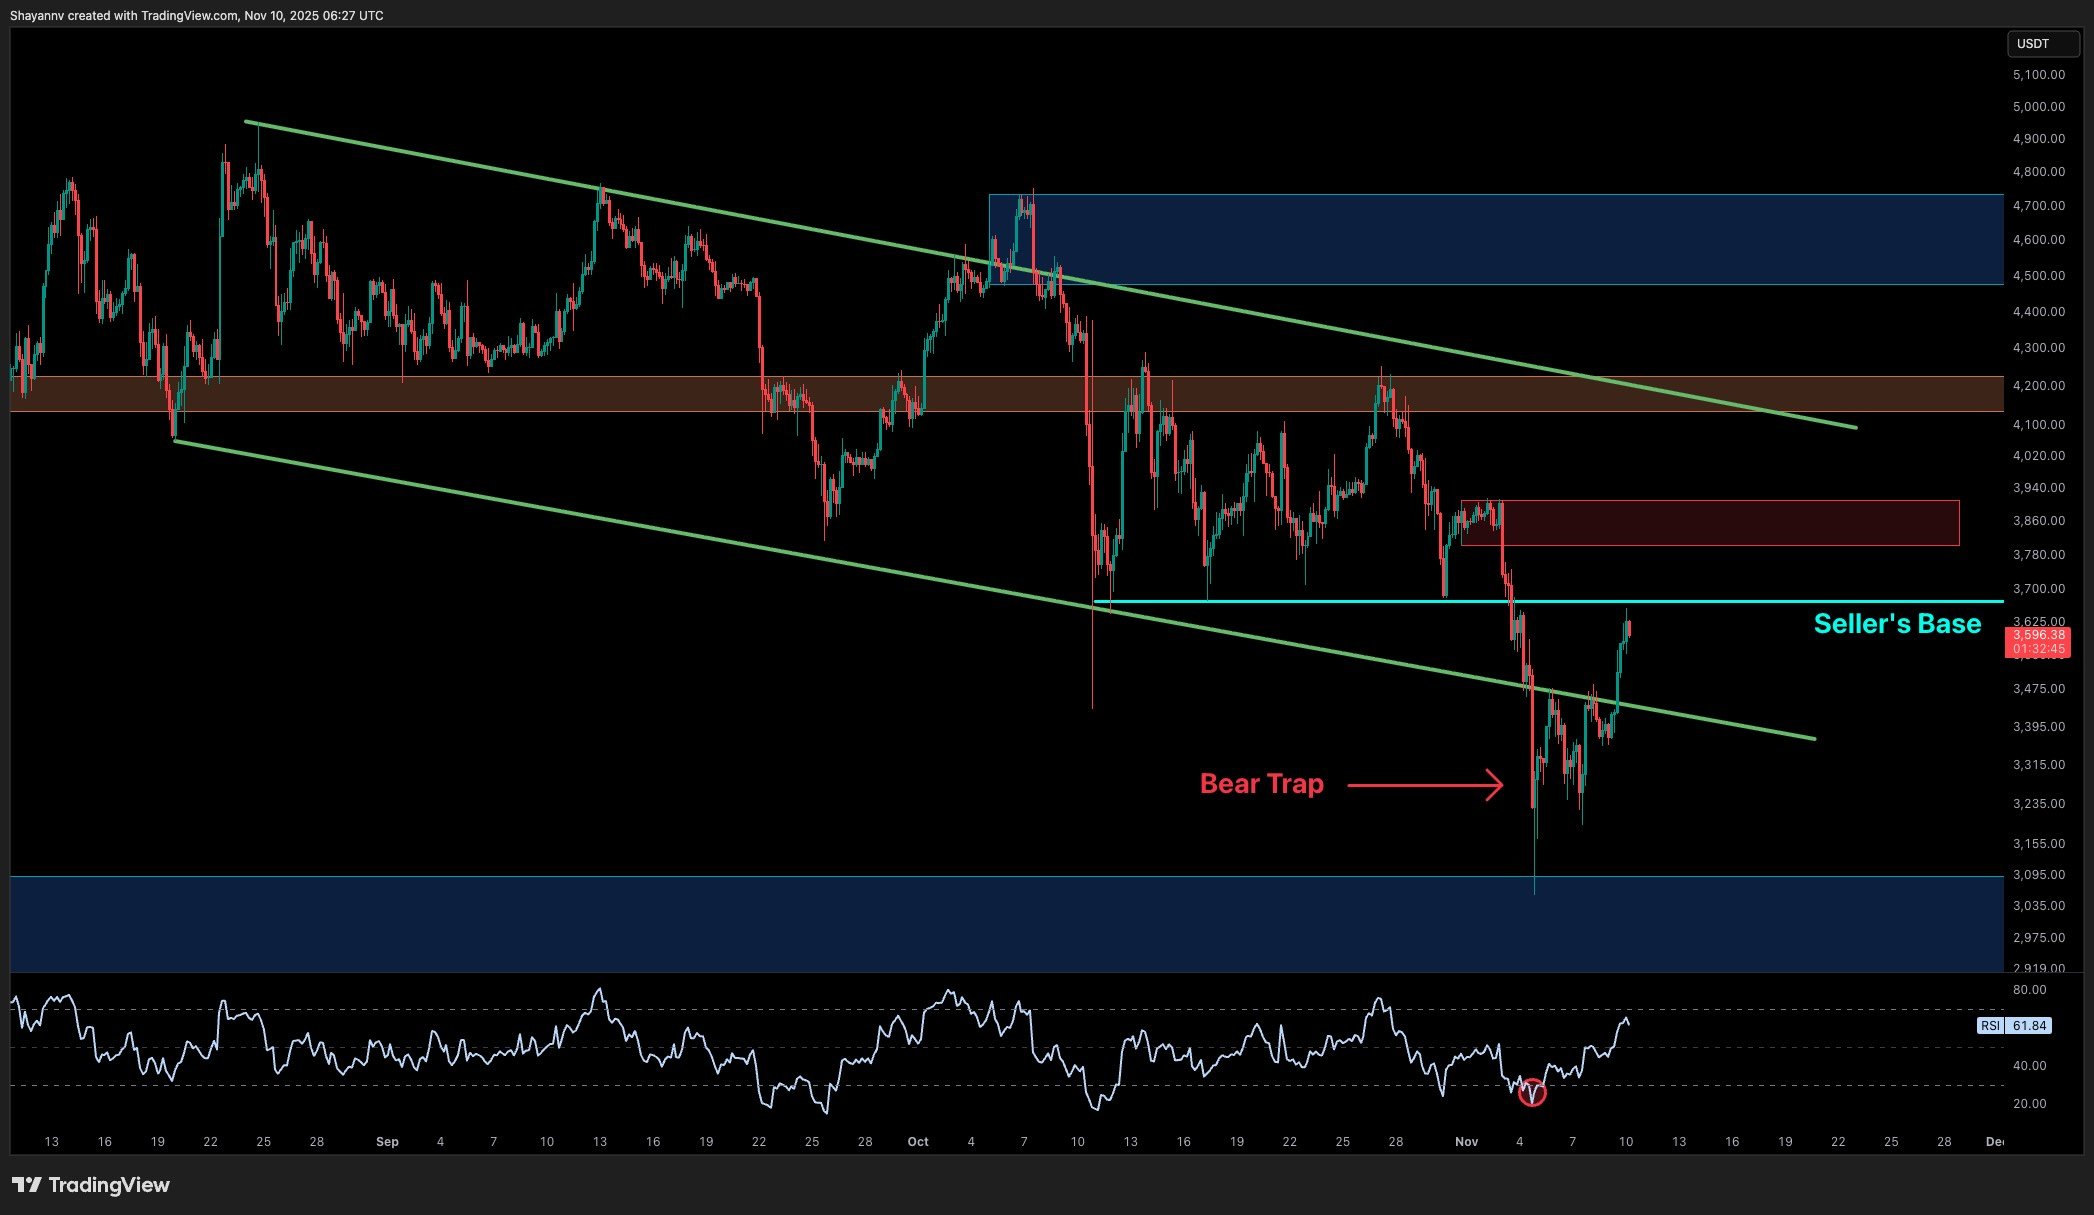 ETH 4-Hour Chart
Sentiment Analysis
The Average Order Size metric for Ethereum shows a significant behavioral shift after recent market turbulence. During the drop towards $3.2K, activity from larger investors spiked, a trend historically seen just before local price bottoms and initial accumulation phases.
This behavior indicates that larger market players are re-engaging in the market at attractive prices, while retail traders are more hesitant. In prior cycles, such shifts from whale accumulation to retail capitulation have often signaled the beginning of trend reversals or late-stage compression before significant price increases.
Should this trend continue, and if the $3-$3.4K range remains robust, Ethereum could be entering a low-volatility accumulation phase, potentially gearing up for a final bullish surge towards the upper region of $4.5K–$4.8K.
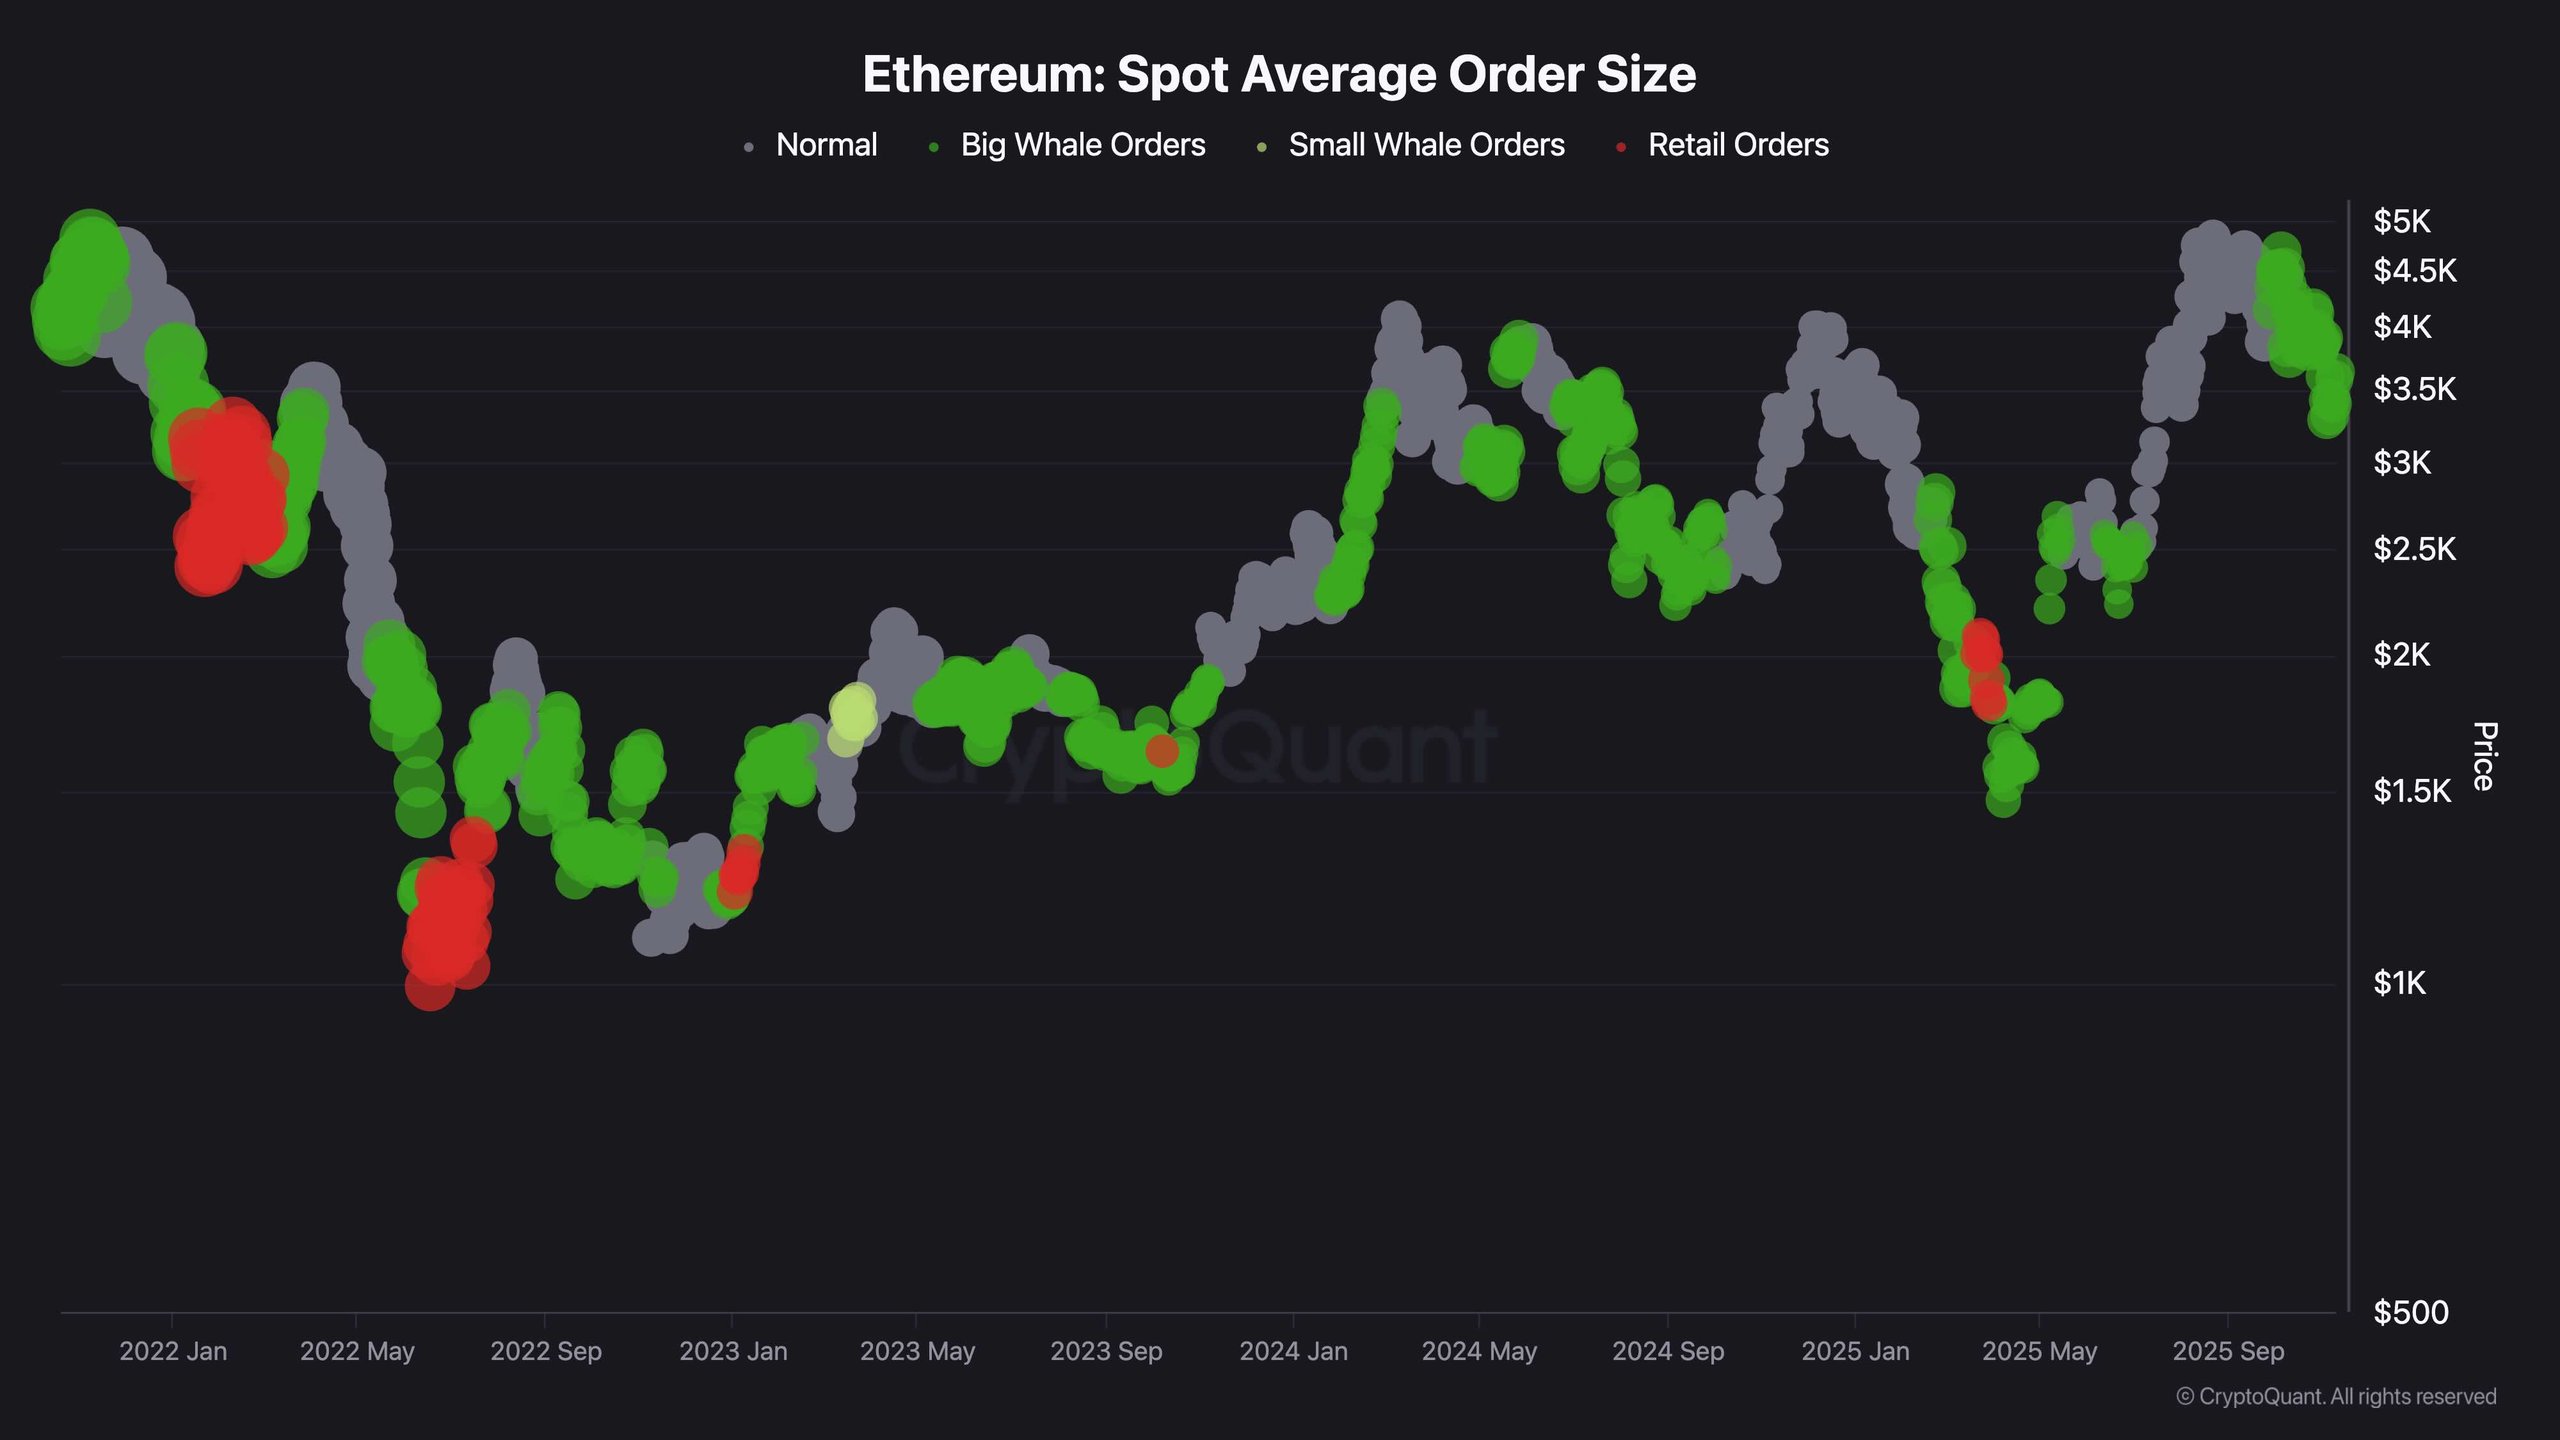 Ethereum Spot Average Order Size
Note: Information herein does not represent financial advice. Always conduct market research before making investment decisions.
