


Bitcoin fell dramatically to $80,600 on Friday, marking a weekly decline exceeding 10% and a monthly drop of 23%, signaling the steepest decline since June 2022. This latest drop prompted BTC to test the 100-week exponential moving average for the first time since October 2023, coinciding with the outset of the current bull cycle.
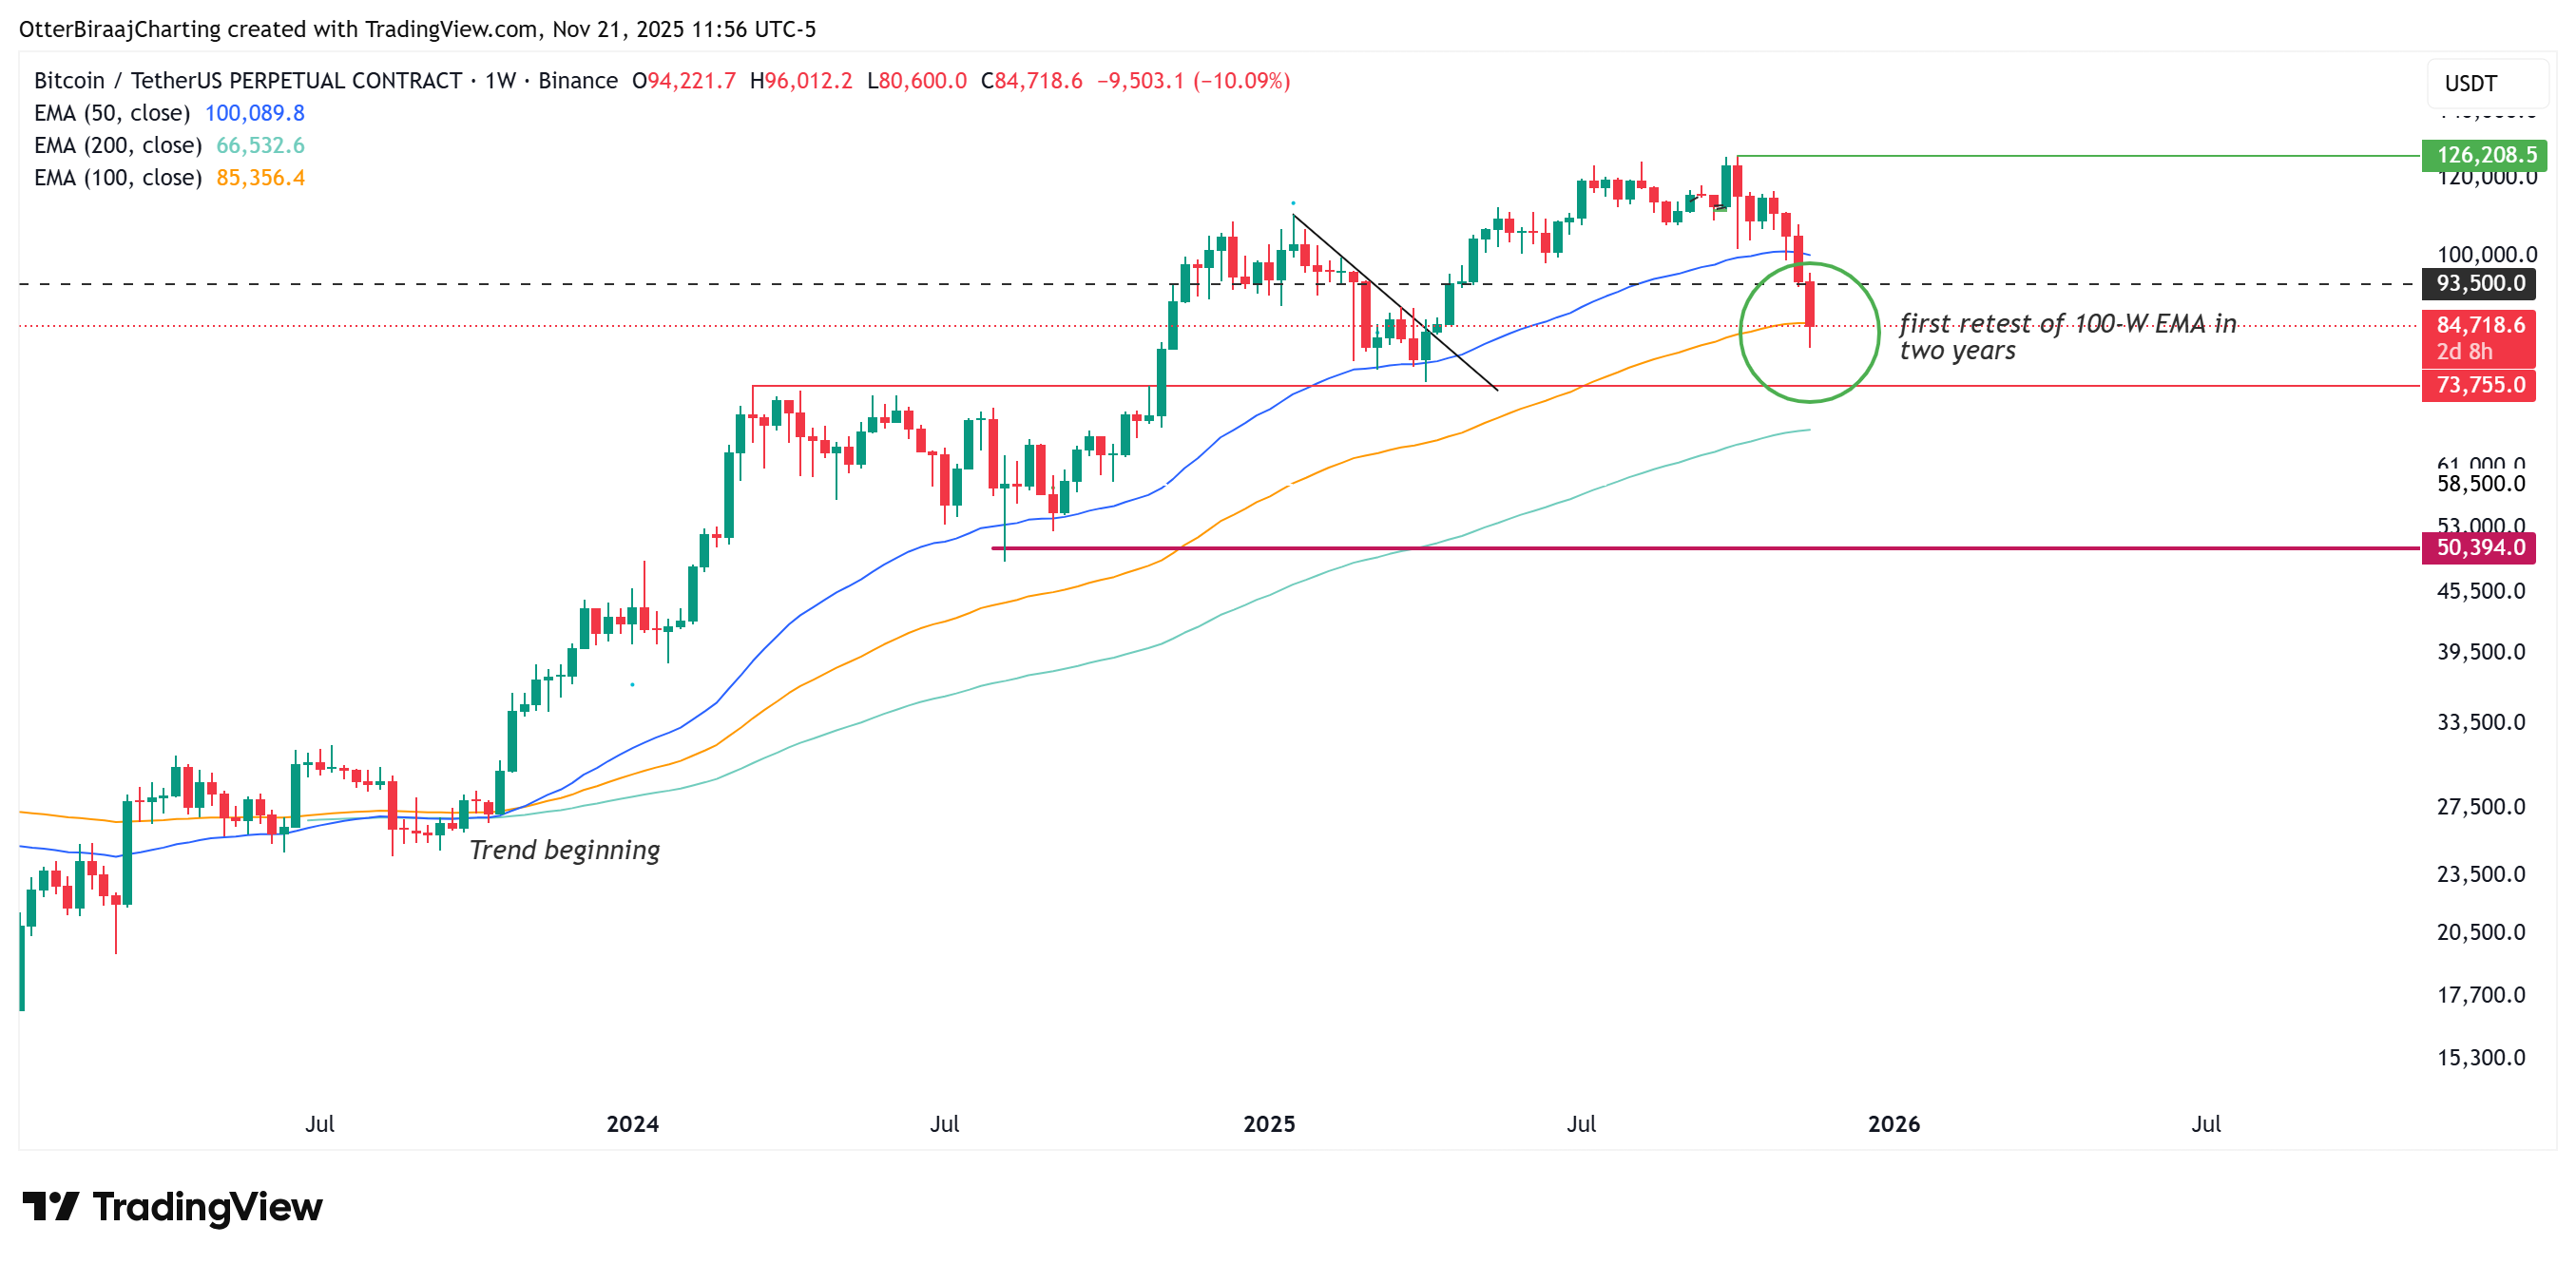 Bitcoin one-week analysis. Source: Cointelegraph/TradingView
Bitcoin futures liquidations surpassed $1 billion, highlighting the severity of this downturn, which the Kobeissi Letter termed as the “the fastest bear market ever.”
Key Takeaways:
- The total crypto market cap has decreased by 33% since October, indicating a rapid unwinding of structures.
- A record outflow from funds and negative ETF flows indicate ongoing institutional selling pressure.
- A crucial macroeconomic liquidity indicator (NFCI) is declining, historically indicating BTC rallies within four to six weeks.
Crypto Market Cap Plummets Amid Accelerated Selling
Since October 6, the overall crypto market cap has dropped from $4.2 trillion to $2.8 trillion, reflecting a 33% drawdown. The Kobeissi Letter categorized it as “one of the quickest bear markets ever,” with selling escalating across all sectors. Digital asset investment products reported $2 billion in weekly outflows, the highest since February.
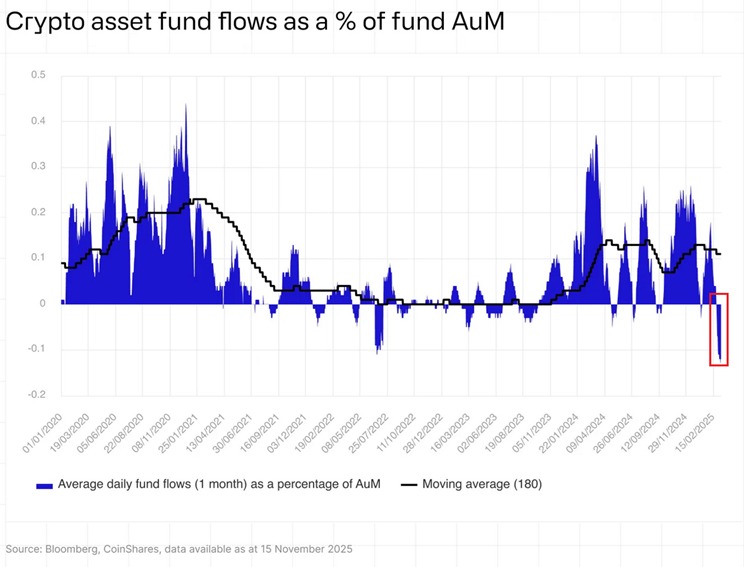 Crypto asset fund flows
During this period, net selling saw $3.2 billion in total outflows over three consecutive weeks. Bitcoin was chiefly responsible for the withdrawals, with $1.4 billion redeemed, while Ether faced $689 million in losses, marking significant declines for both assets in 2025.
Average daily outflows as a percentage of assets under management (AUM) peaked, leading to a total AUM of $191 billion, down 27% since October, confirming a fundamental decline rather than fleeting panic.
ETF flows from U.S. exchanges intensify the market pressure. Spot BTC ETF inflows remain negative, exacerbating the sell-off, while BlackRock’s spot ETF prepares for its largest weekly outflows, nearing to break the $1.17 billion record set in February.
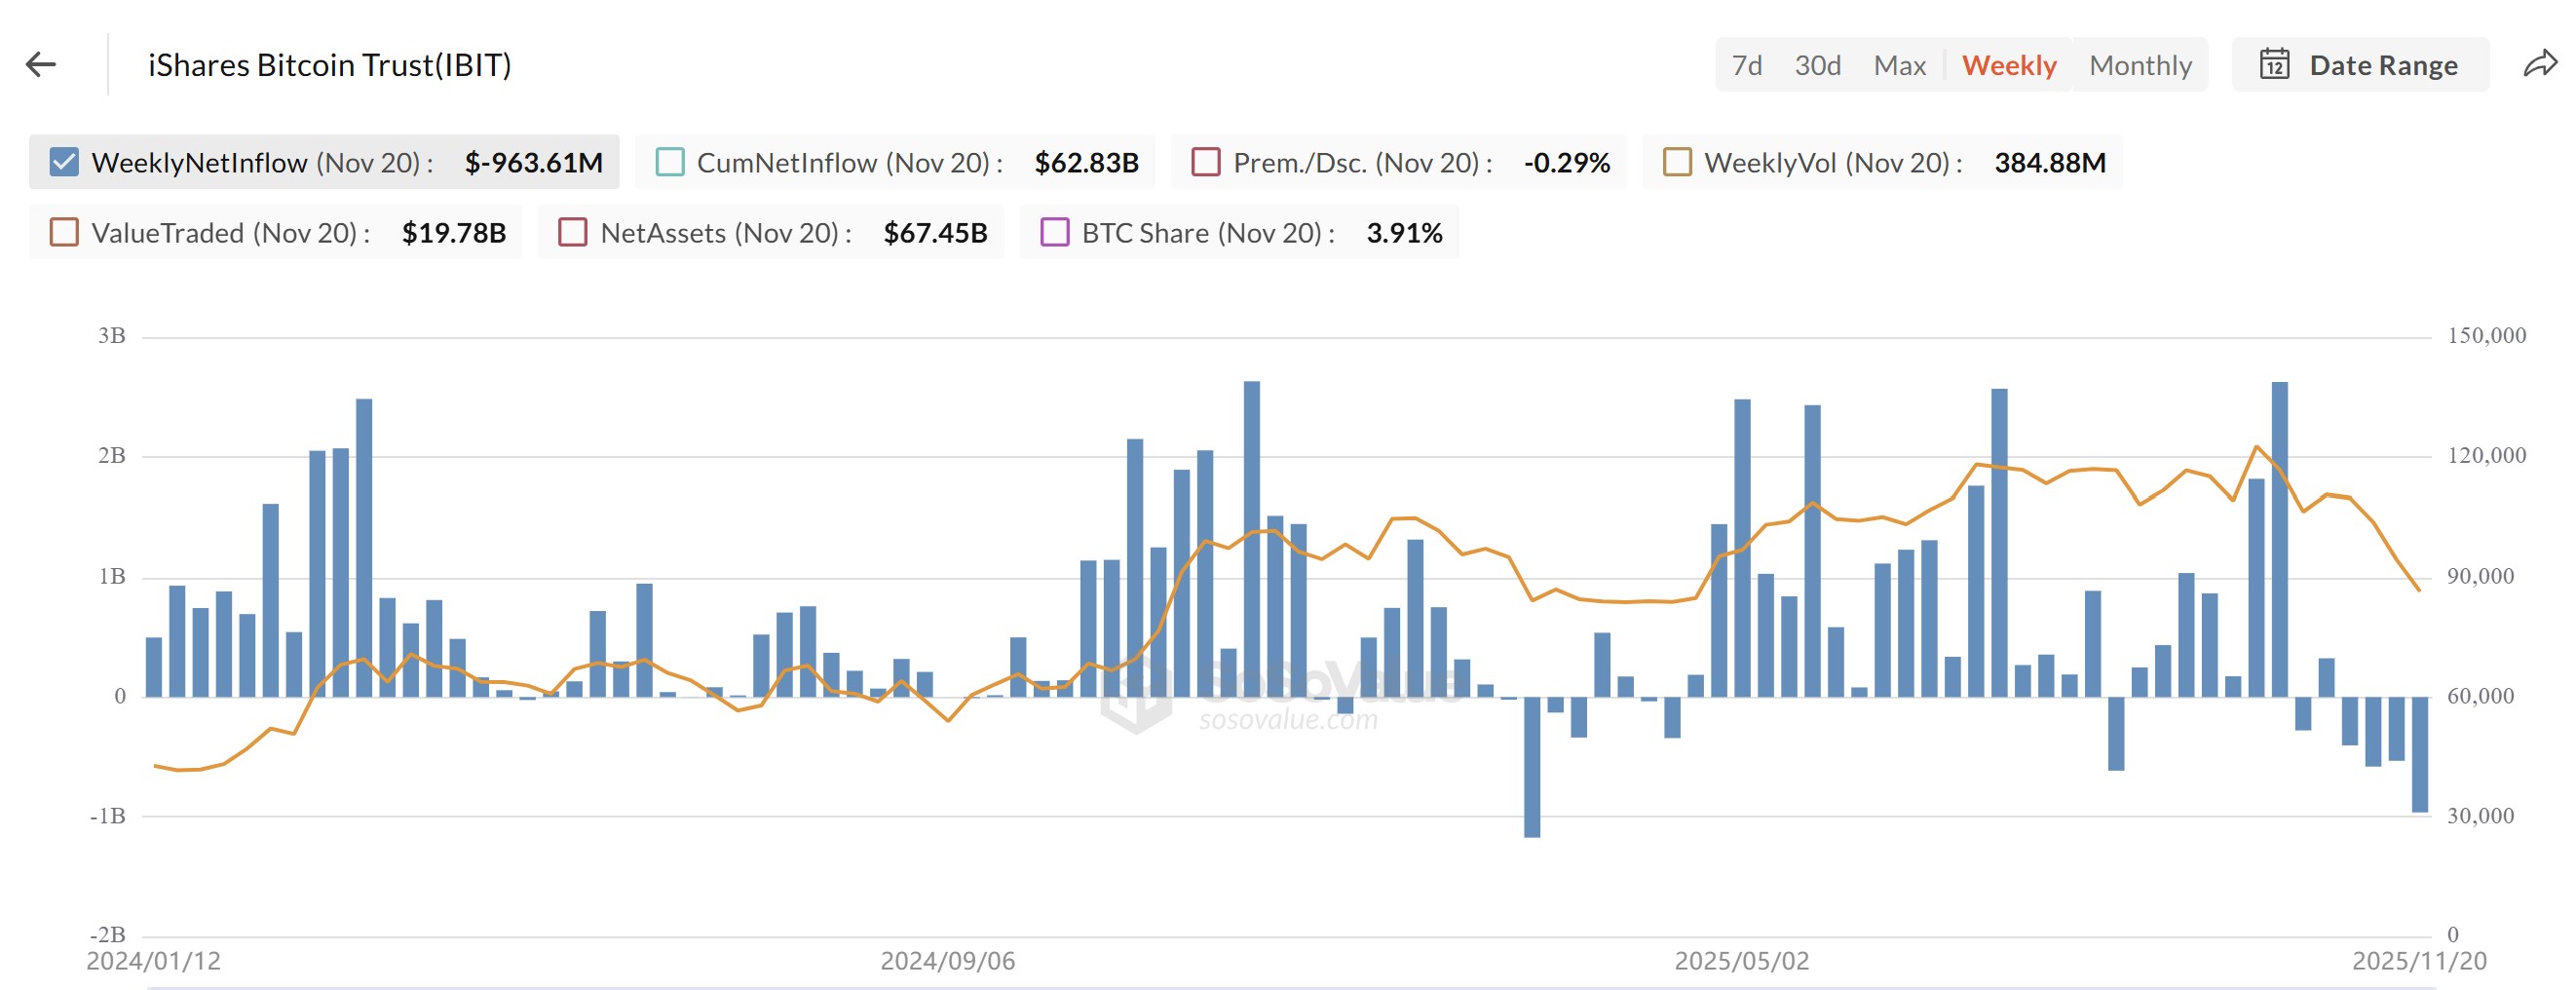 iShares Bitcoin Trust weekly netflows. Source: SoSoValue
Related: Bitcoin slump to $86K brings BTC closer to ‘max pain’ but great ‘discount’ zone
A Potential Macroeconomic Shift Favoring Bitcoin
While numerous analysts are optimistic about a Bitcoin rebound based on technical charts and on-chain indicators, Miad Kasravi has taken a different perspective. He conducted an extensive backtest of 105 financial indicators, asserting that the National Financial Conditions Index (NFCI) consistently leads Bitcoin by four to six weeks during significant macroeconomic changes.
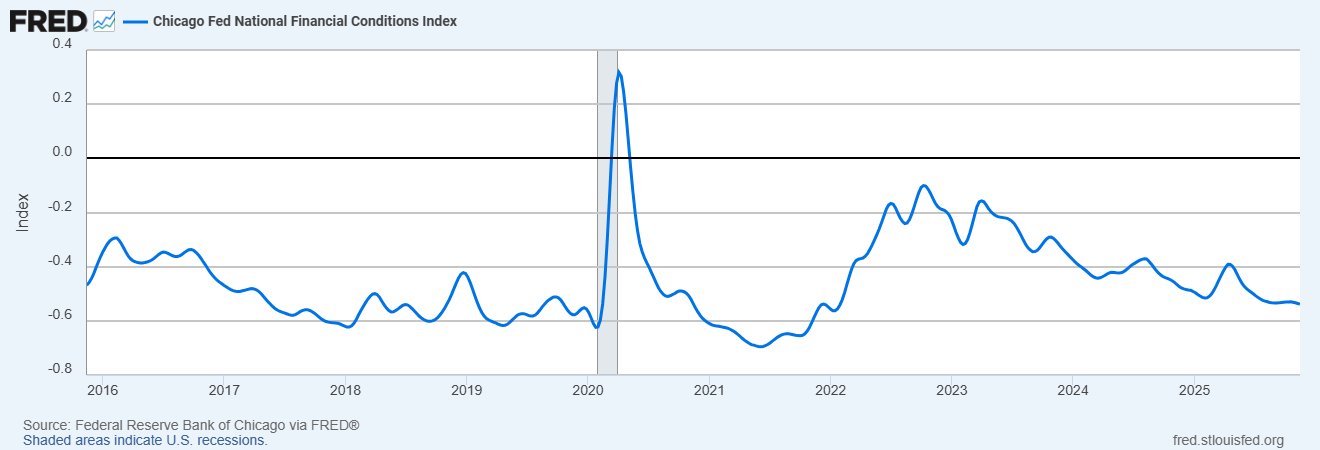 National Financial Conditions Index (NFCI) data. Source: X
This pattern was observable in October 2022 when easier financial conditions preceded a 94% rally, and again in July 2024 when tighter conditions foreshadowed a surge from $50,000 to $107,000.
Currently, the NFCI reads -0.52 and is trending downwards. Historically, a decline of 0.10 points corresponds to a 15%-20% increase in Bitcoin’s price, and movements towards -0.60 often signify an acceleration phase. Furthermore, December will introduce a critical factor: the Federal Reserve’s strategy to transition mortgage-backed securities into Treasury bills.
Kasravi pointed out that while this operation isn’t labeled Quantitative Easing (QE), it could provide liquidity similarly to the 2019 “not-QE” event that preceded a 40% Bitcoin rally.
Should the NFCI continue its decline into mid-December, it would mark the beginnings of a new liquidity expansion phase. Given the index’s historical predictive capacity, Bitcoin’s next substantial shift could happen around early to mid-December 2025, presenting a potential turning point for investors monitoring macroeconomic trends.
Related: Bitcoin realized losses rise to FTX crash levels: Where is the bottom?
This article is for informational purposes only and does not constitute investment advice. Each trading decision carries risk, and individuals should perform their own due diligence before investing.
