
Bitcoin's Rapid Decline Signals Potential Positive Shift Ahead
Bitcoin's recent drop has raised concerns, but analysis suggests a potential recovery in the near future.


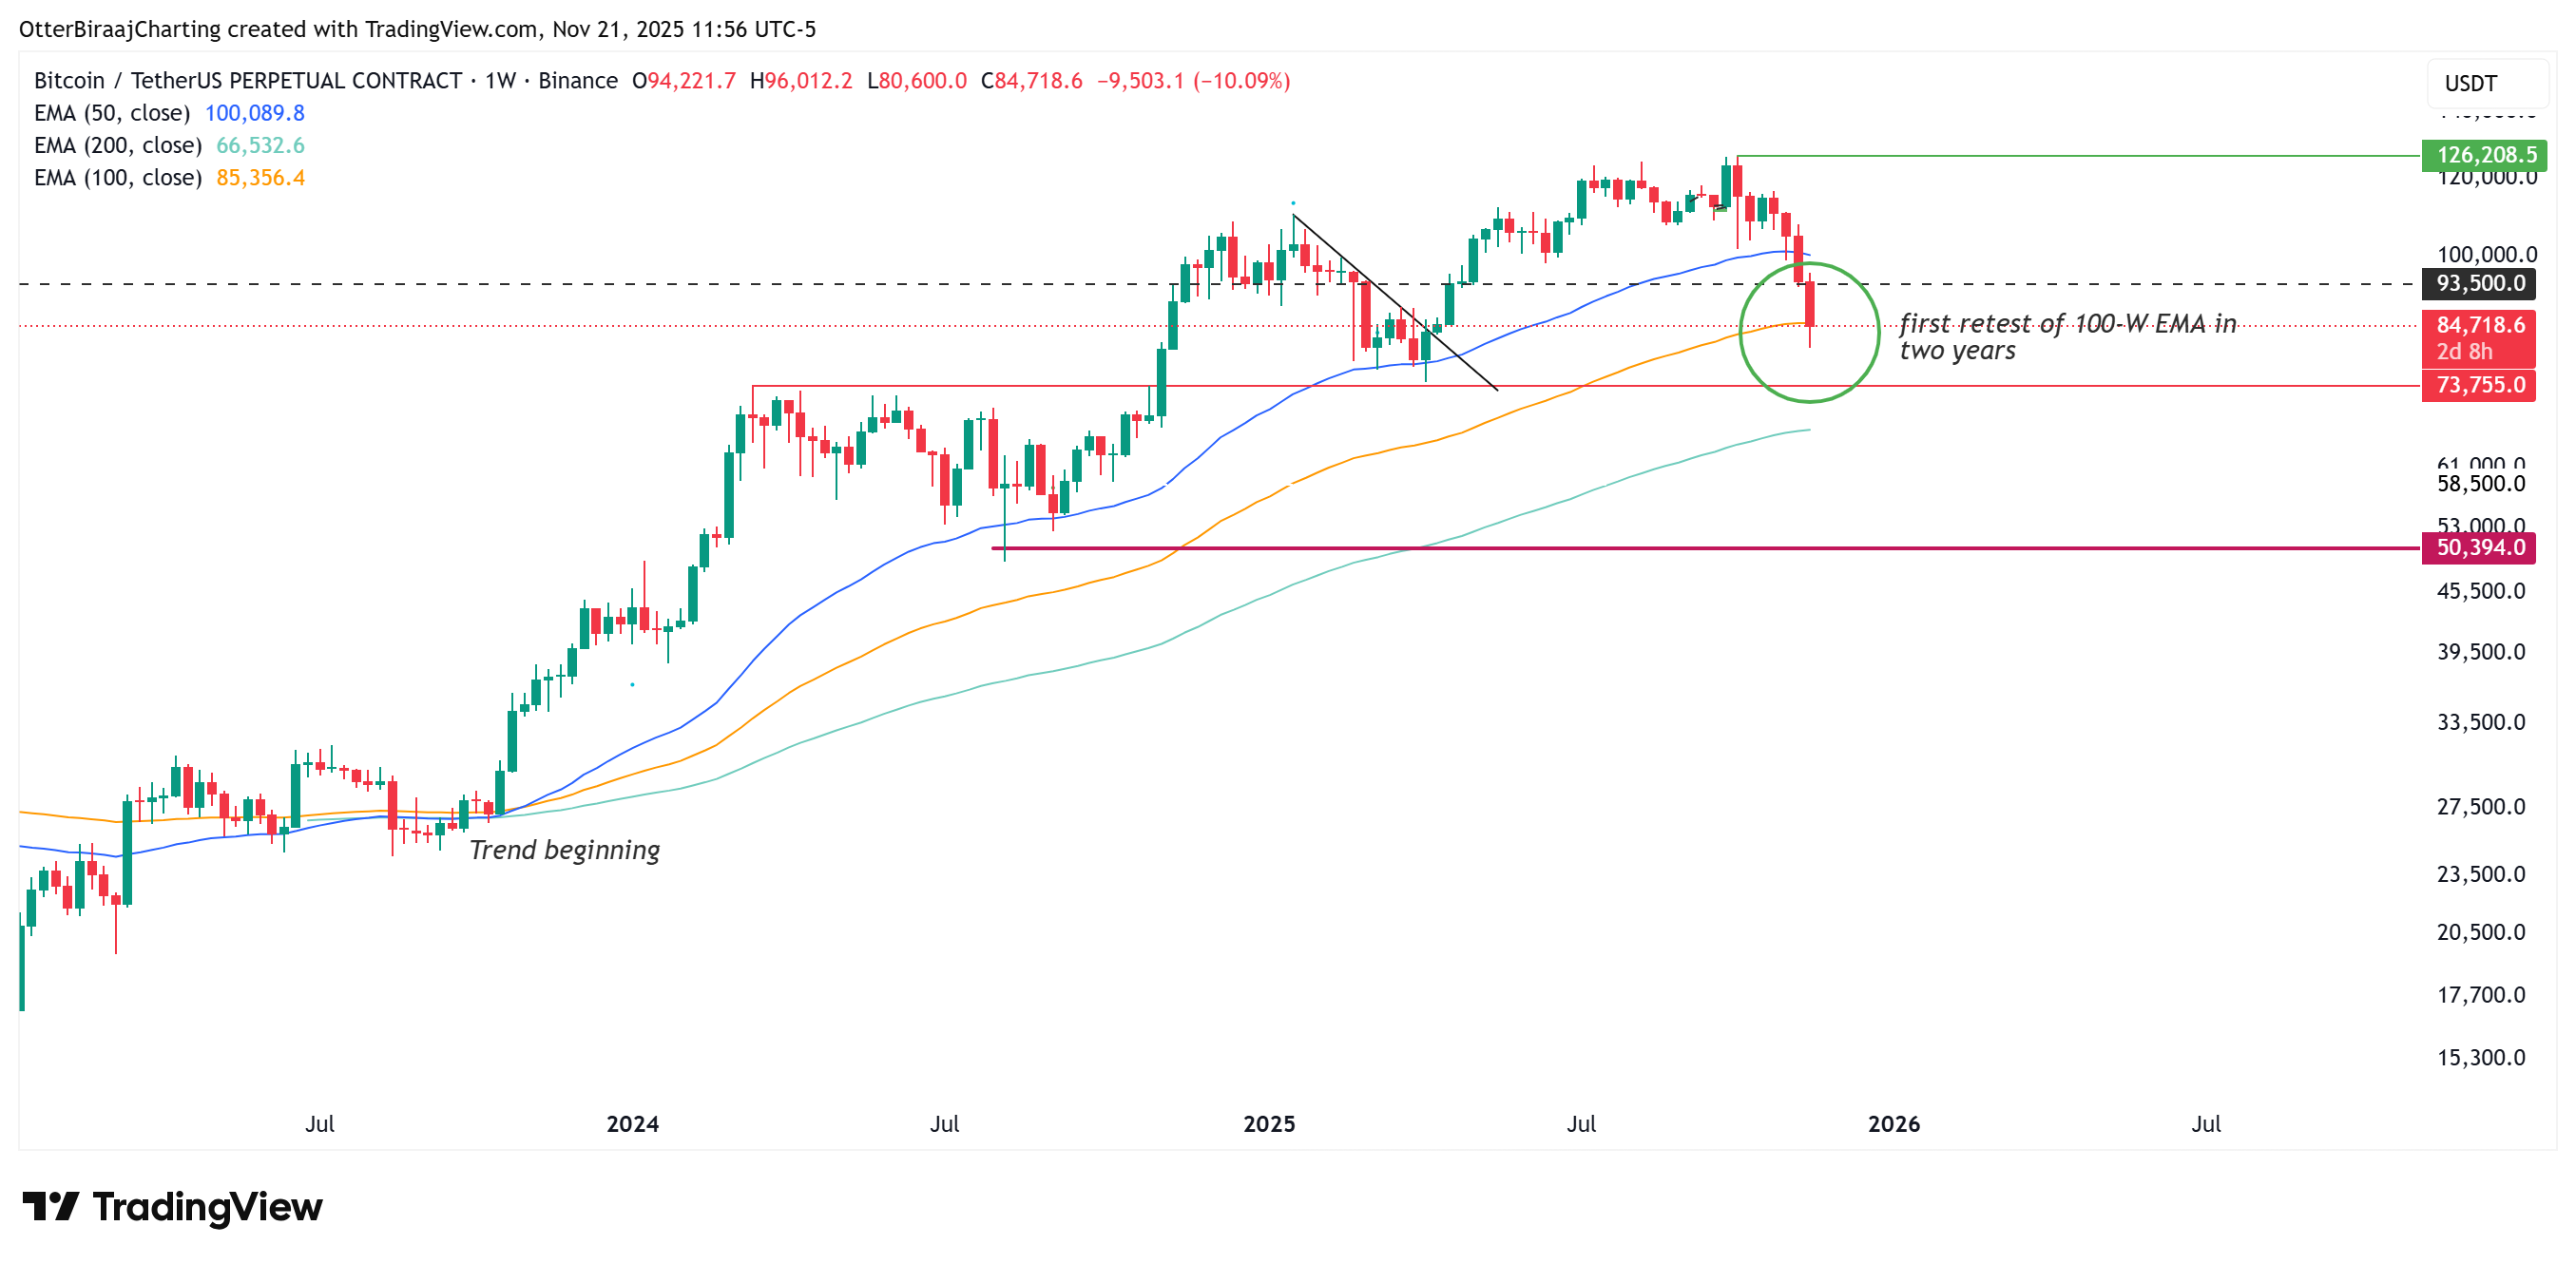
Bitcoin’s price plummeted to $80,600 on Friday, marking over a 10% weekly decline and a 23% drop for the month, the largest since June 2022. This downturn has brought BTC below $84,000 for the first time since October 2023, coinciding with the beginning of the current bullish trend.
 Bitcoin analysis
Bitcoin one-week analysis. Source: Cointelegraph/TradingView
Bitcoin analysis
Bitcoin one-week analysis. Source: Cointelegraph/TradingView
Bitcoin futures liquidations exceeded $1 billion, highlighting the severity of the decline, which the Kobeissi Letter described as the fastest bear market ever.
Key Highlights
- The total crypto market capitalization has decreased by 33% since October.
- There has been record fund outflow and negative ETF flows, indicating ongoing institutional selling pressure.
- A crucial macroeconomic liquidity indicator (NFCI) is trending downward, historically leading BTC rallies by four to six weeks.
Crypto Market Cap Decline
Since October 6, the overall crypto market cap has dropped from $4.2 trillion to $2.8 trillion, a decline of 33%. The Kobeissi Letter noted this as one of the fastest bear markets in crypto history, with significant selling evident across major sectors.
 Crypto asset fund flows
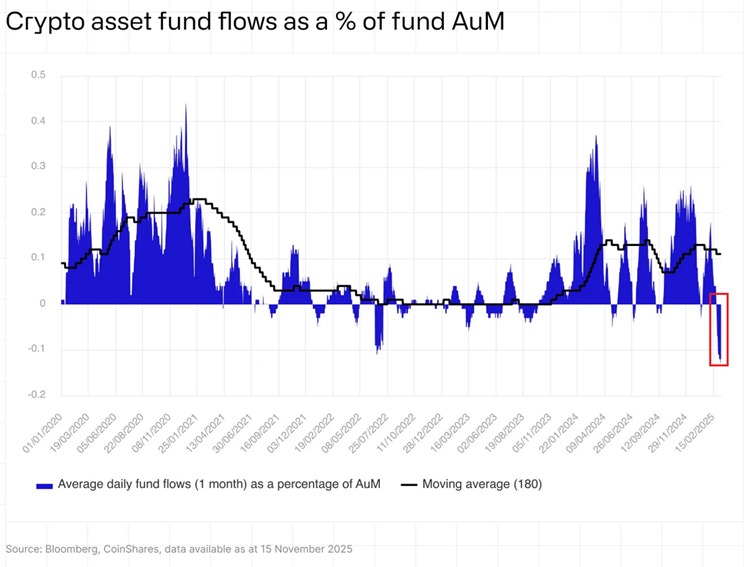
 as a percentage of fund AUM. Source: Kobeissi letter/X
Crypto asset fund flows
Crypto asset fund flows as a percentage of fund AUM. Source: Kobeissi letter/X
This has led to three consecutive weeks of net selling, totaling $3.2 billion in outflows, with Bitcoin leading the withdrawals at $1.4 billion and Ether at $689 million—amounts that reflect some of the largest weekly declines of the year.
The pressure on US exchange-traded funds (ETFs) has intensified, with spot BTC ETF flows remaining negative, further driving the sell-off. BlackRock’s spot ETF is nearing its highest weekly outflow ever, potentially surpassing its previous record of $1.17 billion from February.
Potential liquidity shift for Bitcoin
Despite some analysts pointing to potential bottoms in Bitcoin prices, Miad Kasravi conducted a long-term backtest of 105 financial indicators, suggesting that the National Financial Conditions Index (NFCI) is a key indicator leading Bitcoin by four to six weeks during significant macroeconomic changes. The current NFCI, at -0.52, is declining. Historically, each 0.10 point dip corresponds to a 15%-20% increase in Bitcoin price.
This downtrend could indicate that if it continues through mid-December, an expansion of liquidity may emerge, which aligns with Bitcoin’s next major movement cycle anticipated in early to mid-December 2025.
This article does not provide investment advice and emphasizes that any trading decisions should be made after thorough research.
