Bitcoin Price Forecast: Are We Approaching $80,000 or $96,000 Next?
Bitcoin faces strong resistance while attempting to stabilize post-sell-off amidst significant technical developments.


Bitcoin continues to face challenges as it remains below crucial resistance levels following an extensive sell-off. Despite being in a broader bullish order-flow zone, the general trend is firmly bearish, demanding significant reclaiming efforts for any genuine reversal to happen.
Technical Review
By Shayan
Daily Overview
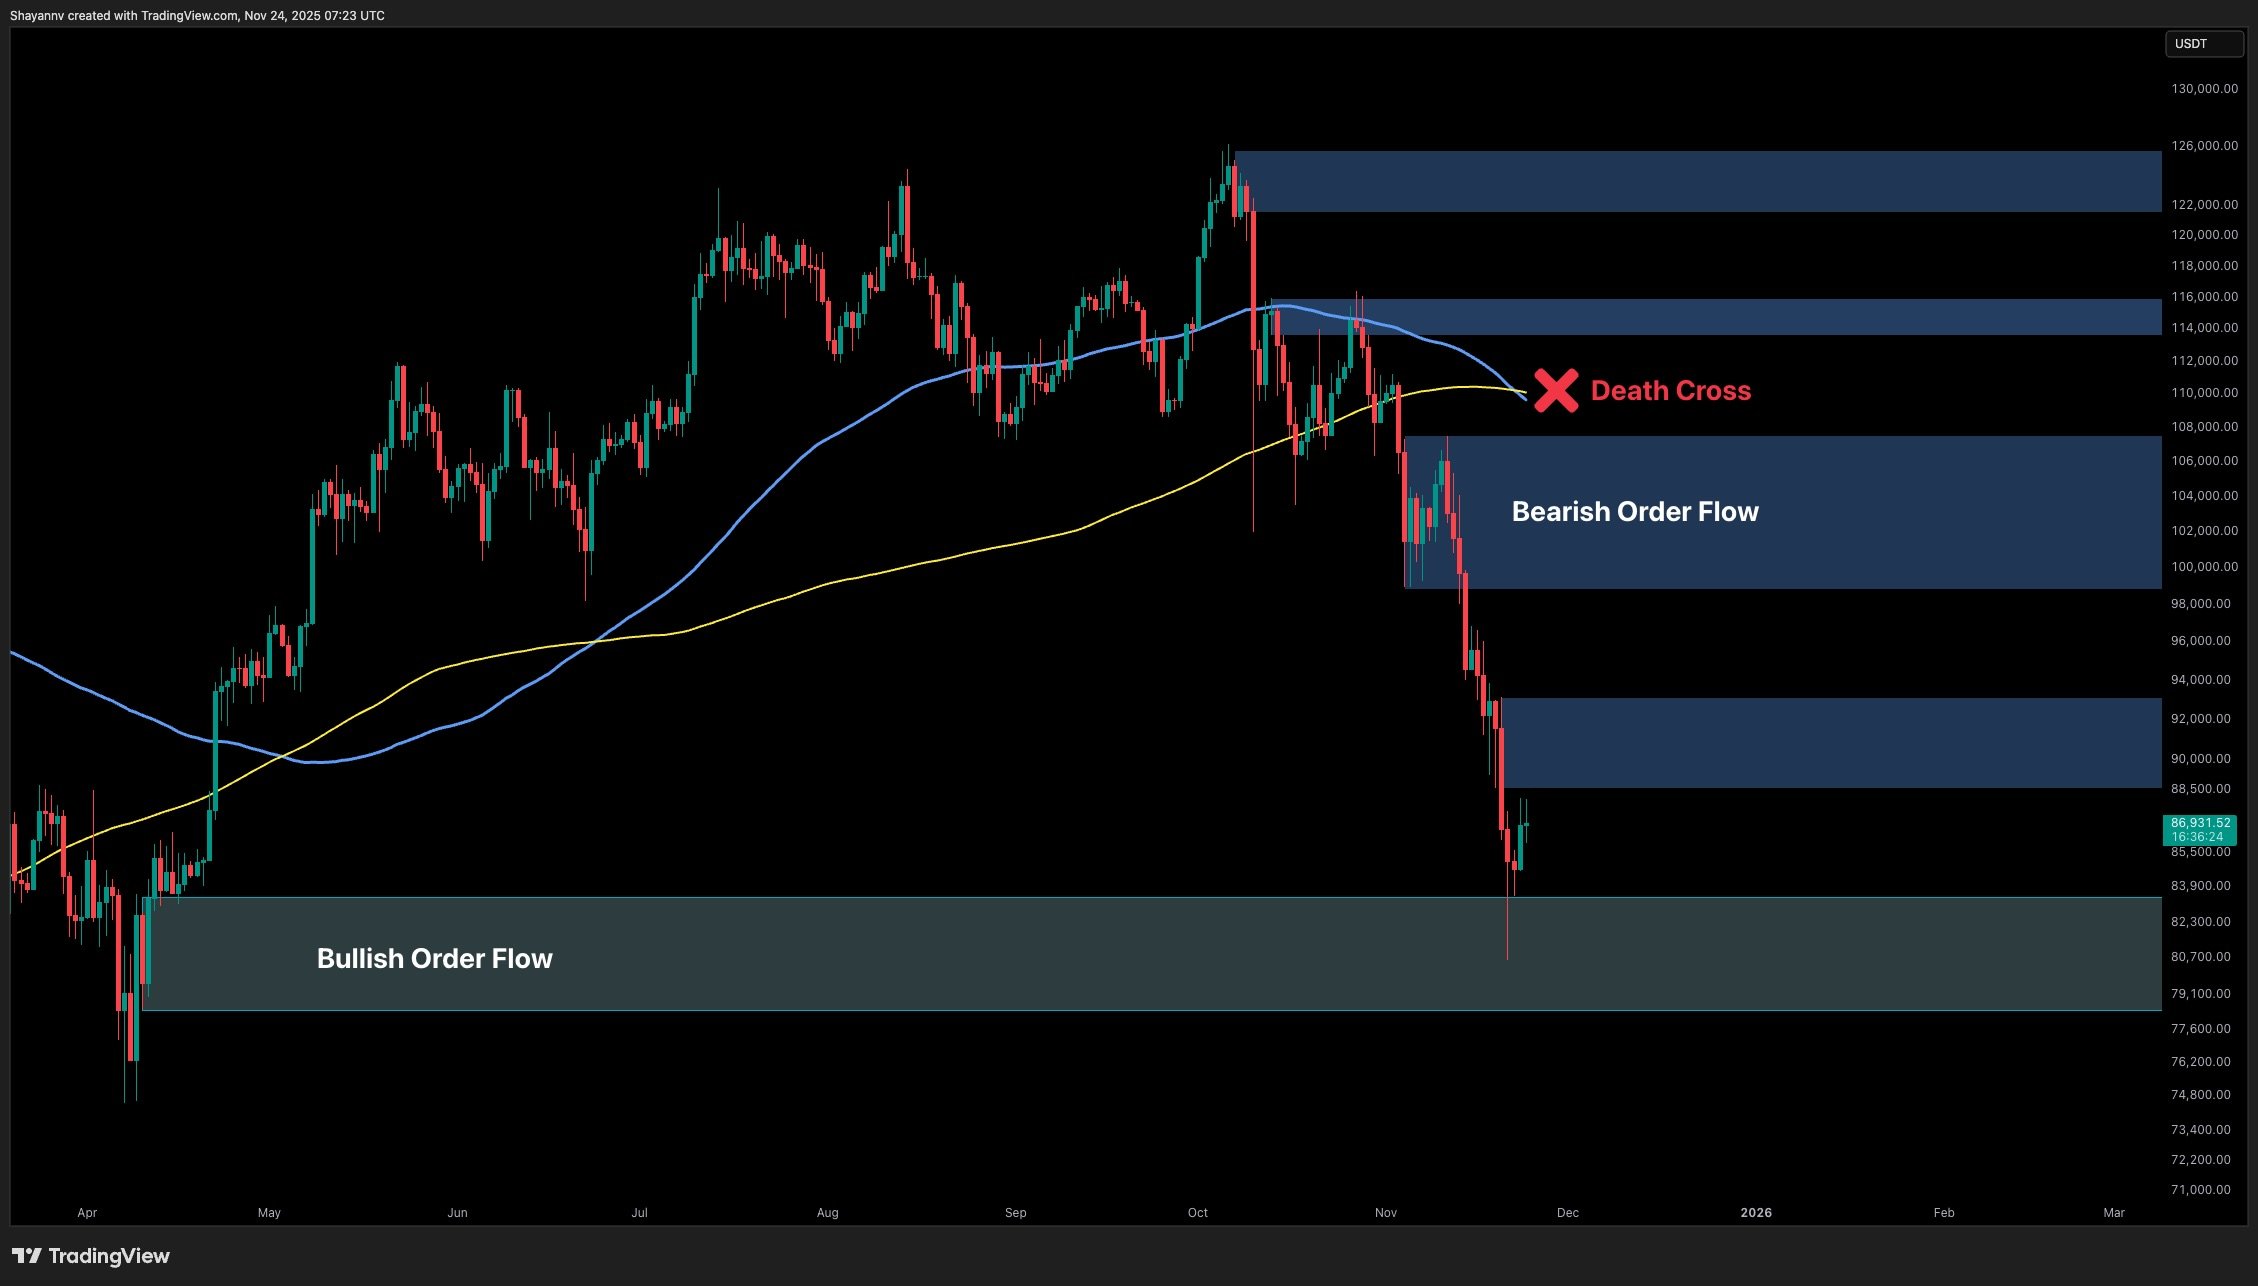
Bitcoin has retraced to the crucial bullish order-flow area after struggling to regain any significant high-timeframe structure. The recent formation of a death-cross between the 100-day and 200-day moving averages indicates a decisive shift towards prolonged bearish momentum, particularly as long as the price remains under the $100K–$104K zone.
The latest drop to around $80K demonstrates that liquidity beneath previous macro lows has been depleted. Buyers reacted firmly at the lower boundary of the green accumulation zone, but the bounce remains a correction. As long as the market operates below the $92K–$96K supply area, this rise should be regarded as temporary relief within an overall downtrend.
If buyers manage to establish stability over the $96K pivot, a retest of the $100K–$104K range could become plausible. However, failing to reclaim this area would leave the market vulnerable for deeper retracements towards the lower accumulation band between $80K and $83K.
BTC Daily Chart
4-Hour Overview
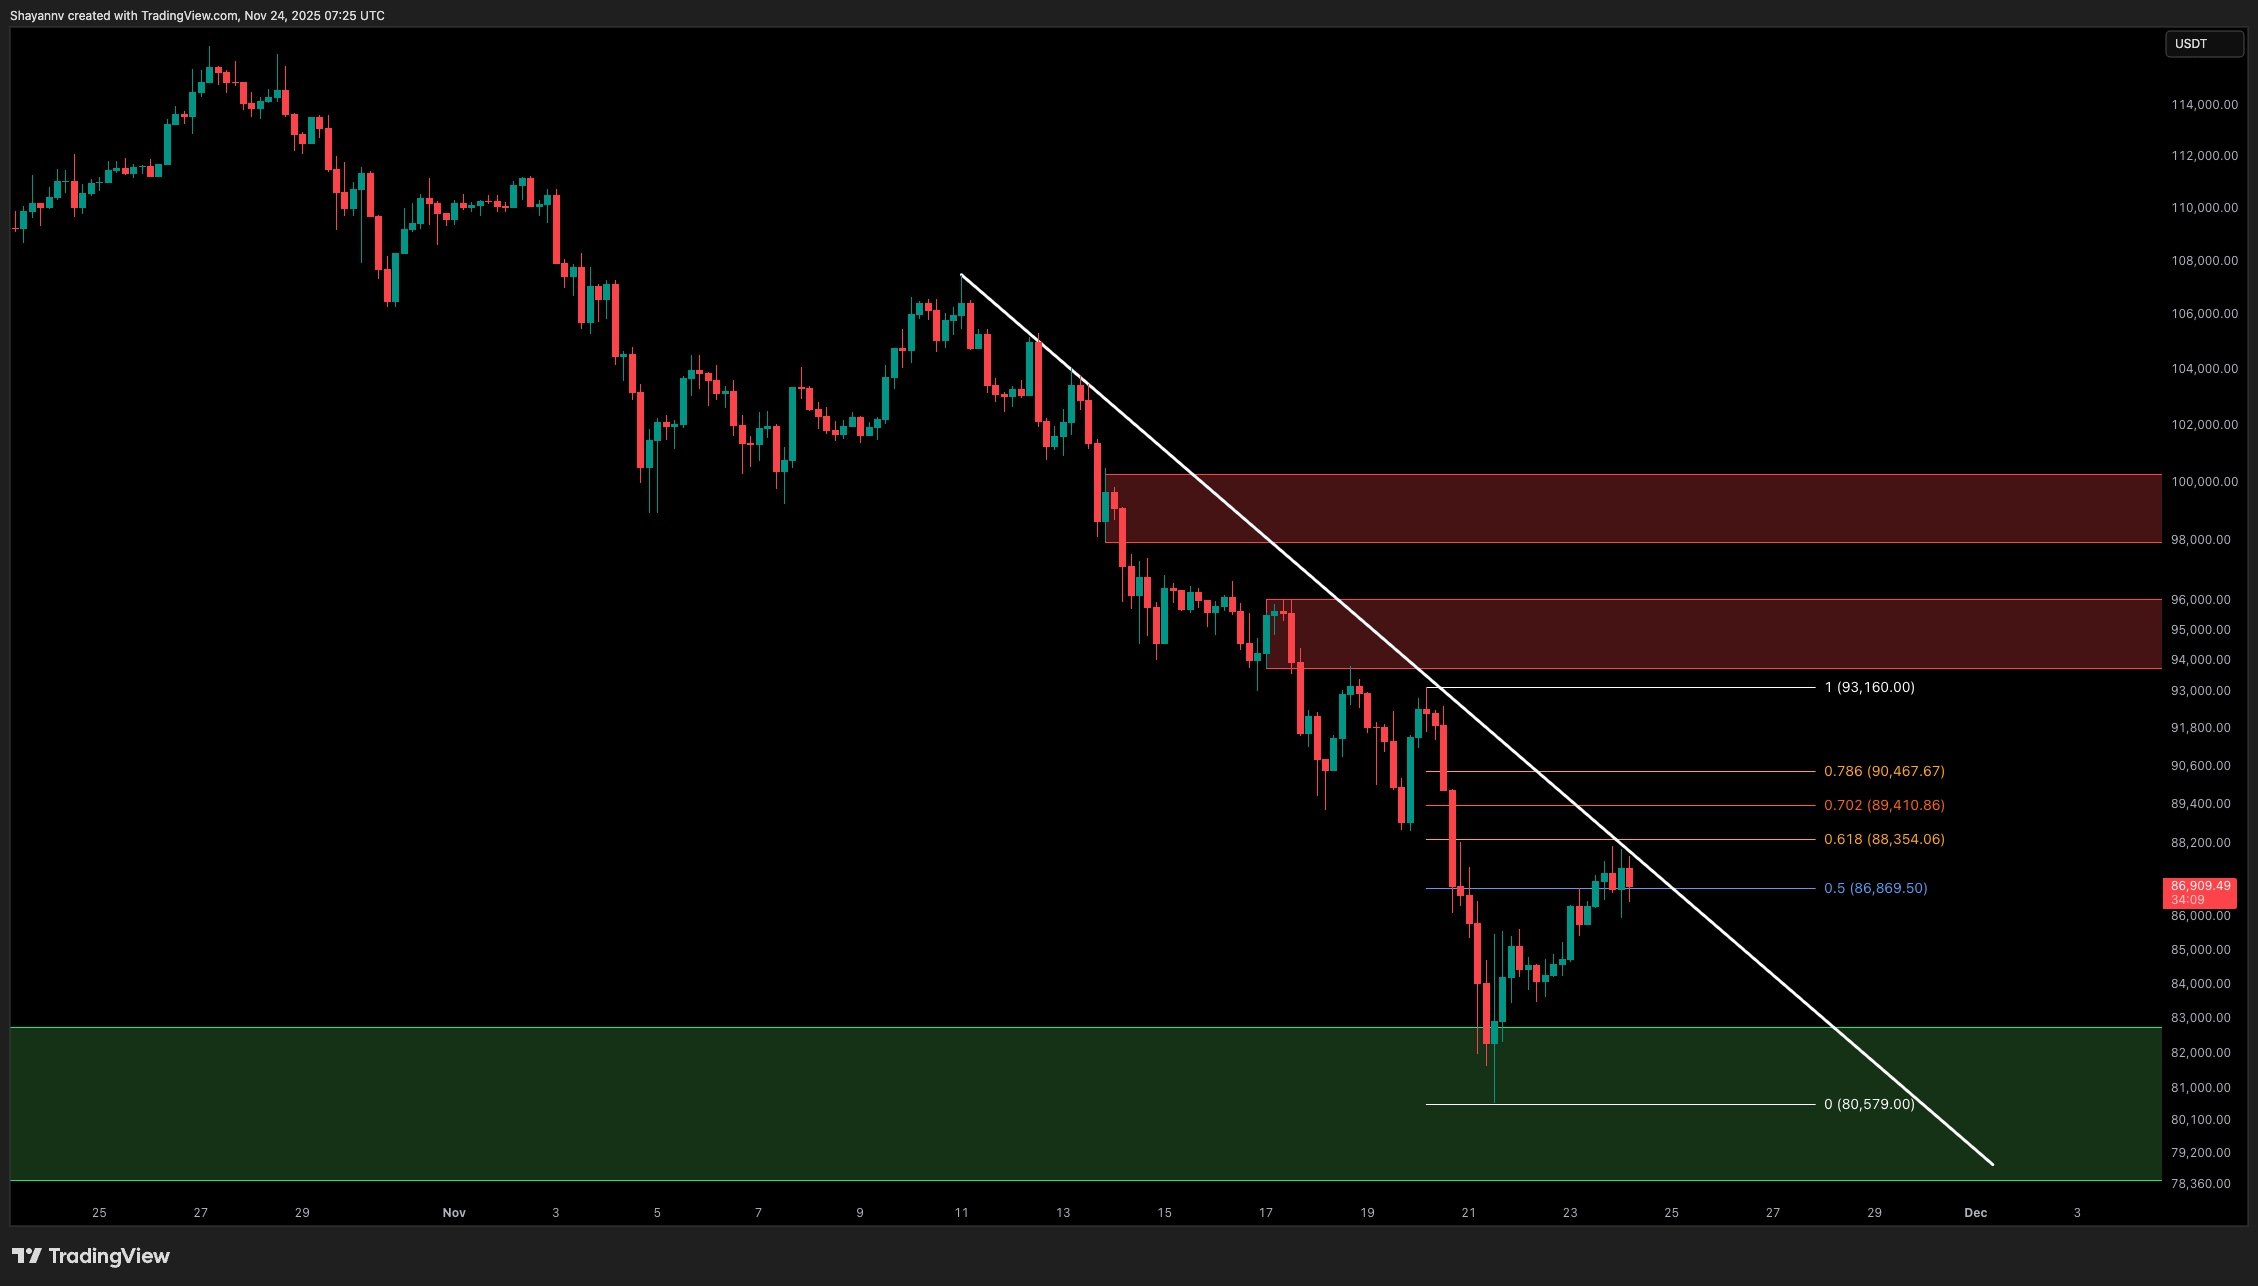
The short-term structure is oriented downside as the price remains constrained by a downward trendline. Each rally has faltered at lower supply points, with the latest pullback stalling at the 0.5–0.618 Fibonacci regions.
Persistent trading below the descending trendline limits upside potential. A confirmed break above the $90K–$92K area would suggest a momentum shift towards the upside, paving the way to target the $96K–$98K inefficiency zone. Rejection at the current trendline could push the asset back towards the $83K–$86K support range, where significant volatility is present.
 BTC 4-Hour Chart
On-Chain Insights
By Shayan
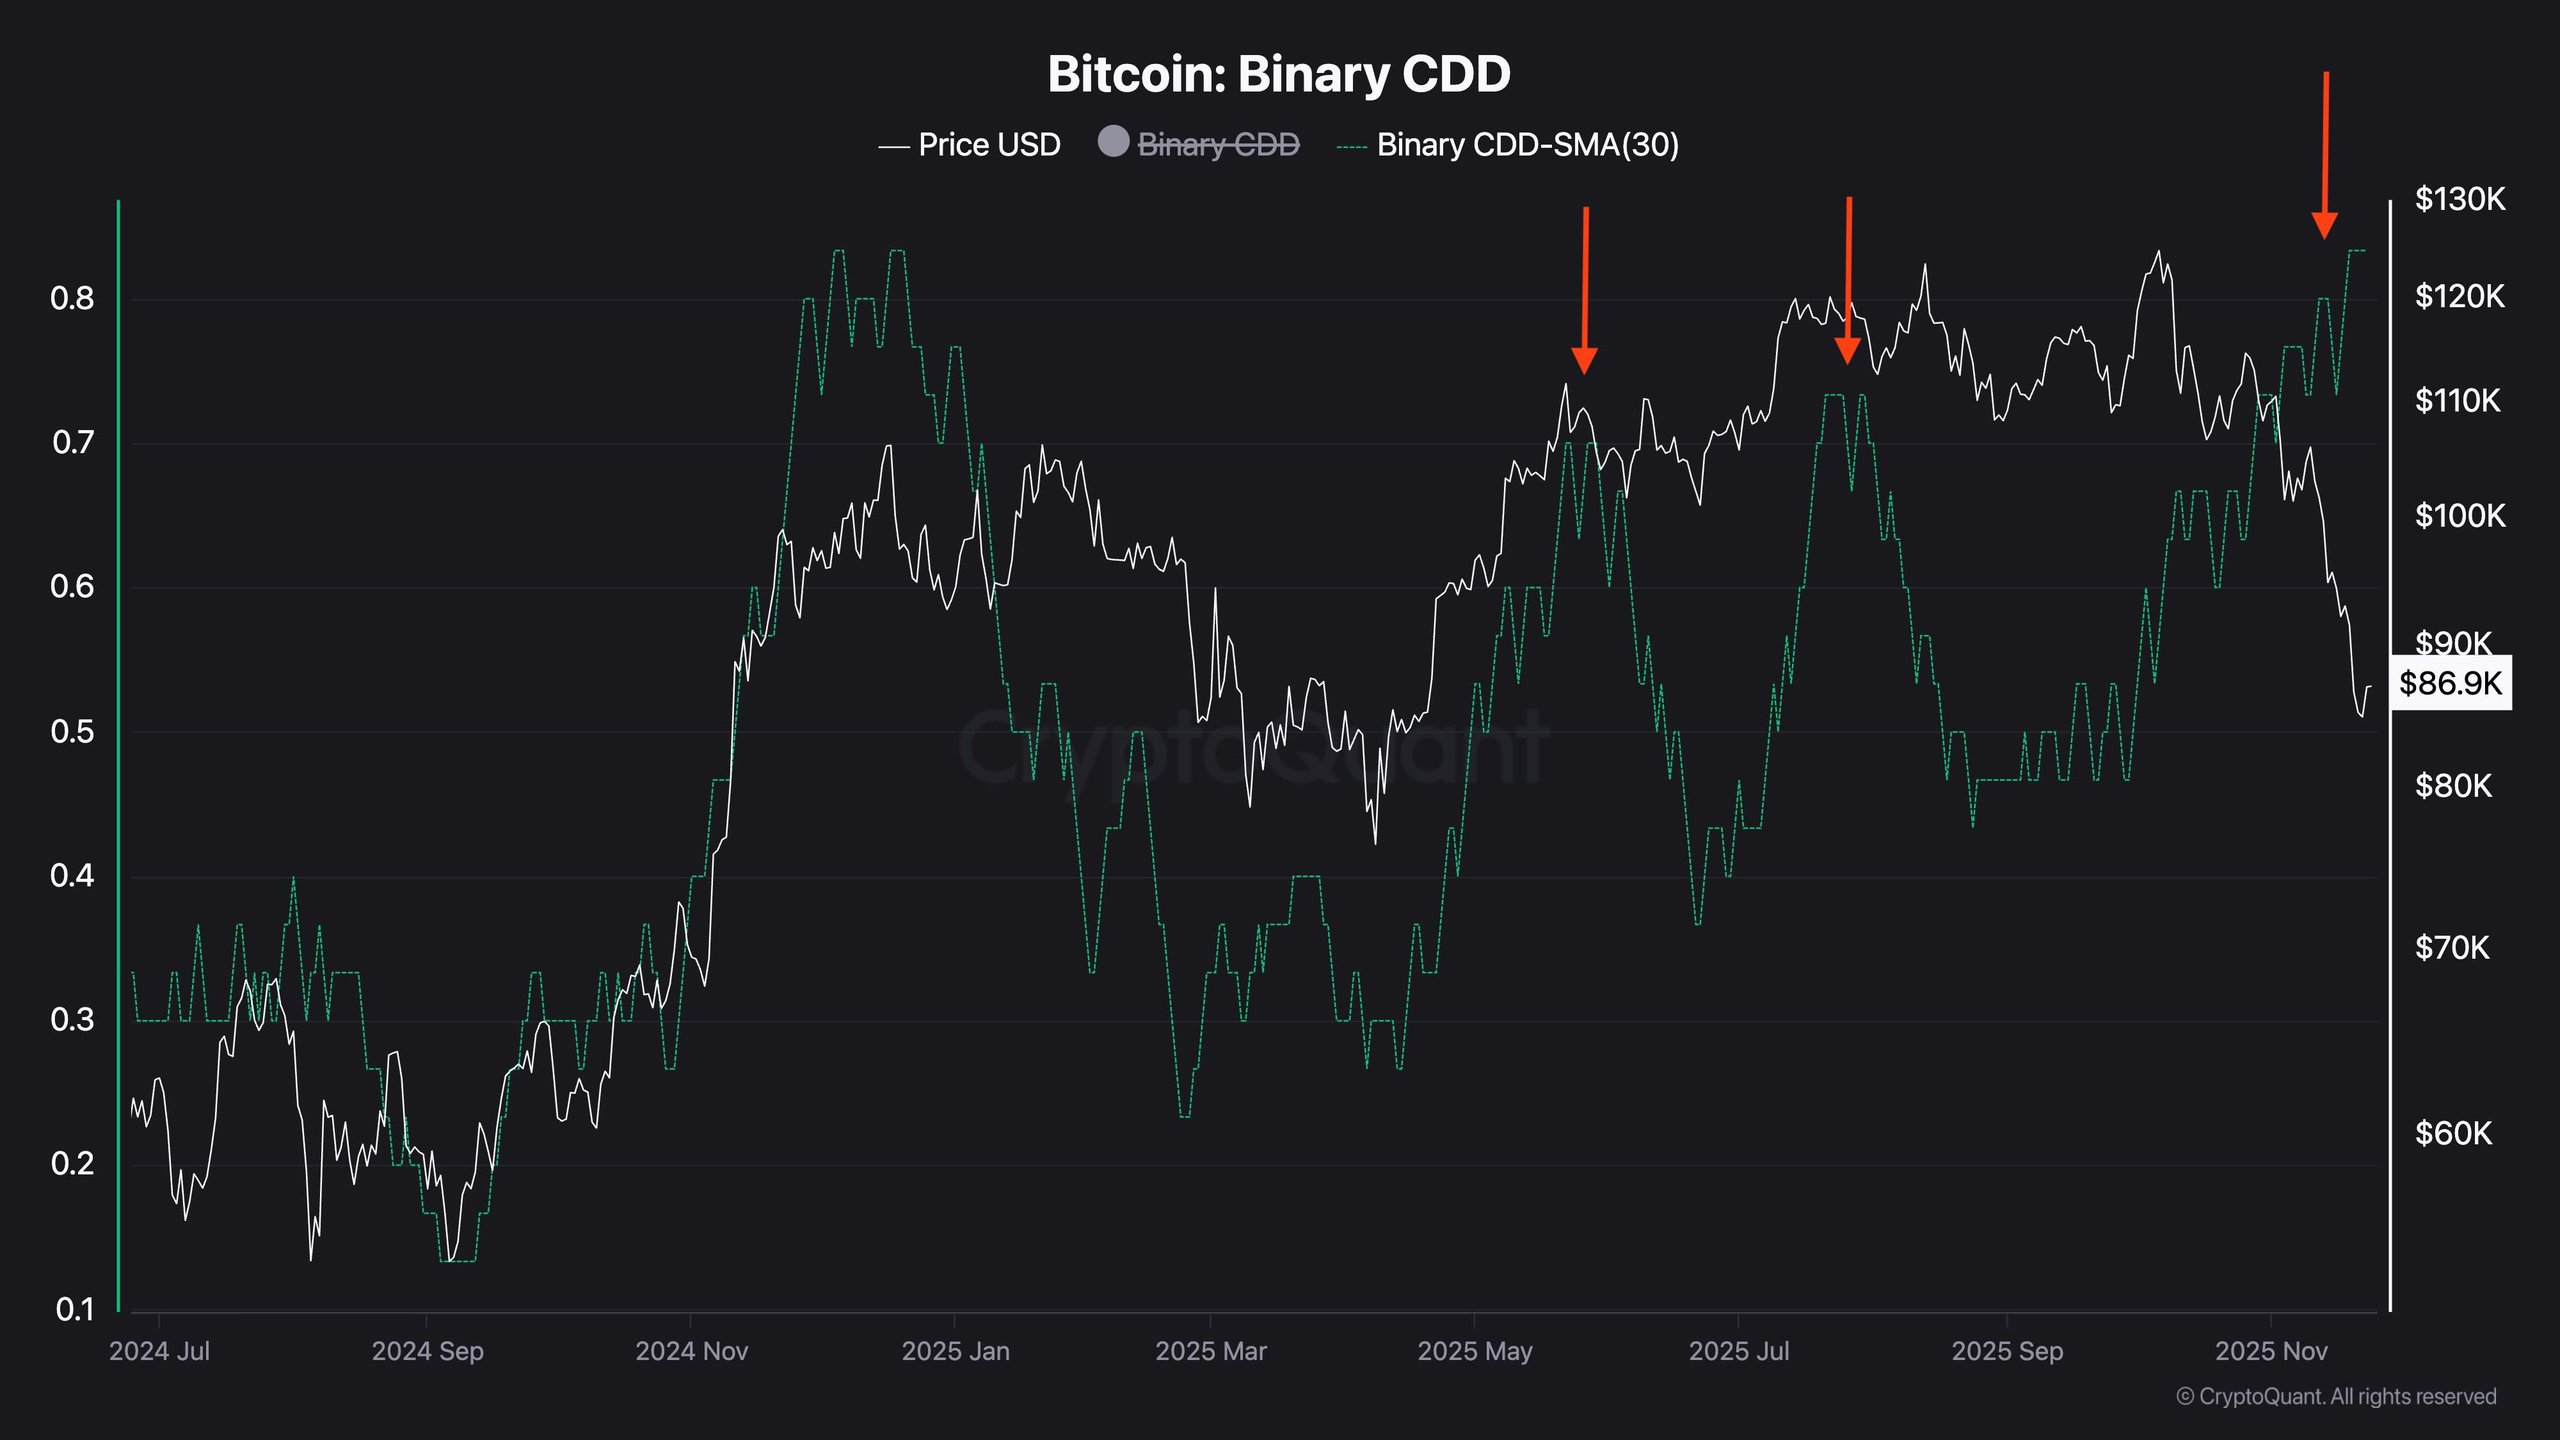
Bitcoin’s Binary CDD indicates a substantial change in behavior among long-term, savvy investors. The marked upward spikes denote points where experienced holders decided to offload BTC into bullish phases, while retail interest was increasing. Each spike parallels local or macro peaks, confirming a reactivation of dormant supply at premium rates.
This behavior indicates that profit-taking actions by long-term holders started before the market downturn, signaling classic distribution phases.
In contrast, short-term holders are aggressively capitulating, as SOPR metrics reveal substantial selling at losses. This combined action of smart-money distribution and panic selling in the market denotes the late stages of corrections rather than the early ones.
While this does not guarantee an immediate market turnaround, clearing out weaker participants and the stabilizing around the lower accumulation zone implies the market is potentially transitioning into an accumulation phase. Validating defense of the $80K–$83K realized demand area would support this hypothesis, although a decisive break below this zone would indicate incompleteness in the washout process.
 On-Chain Analysis
For further insights, visit CryptoPotato.
