Ethereum Price Outlook: Analyzing ETH's Path Following Its Return Above $3,000
Ethereum has bounced back above $3,000, triggering optimism among traders. This article explores potential resistance levels and market sentiment.


Ethereum has managed to rebound above the $3,000 mark after enduring weeks of downward pressure, instilling hope for a potential trend reversal. Although short-term price movements appear more favorable, pivotal resistance levels and overall market sentiment continue to keep traders on high alert.
Technical Analysis
Daily Chart
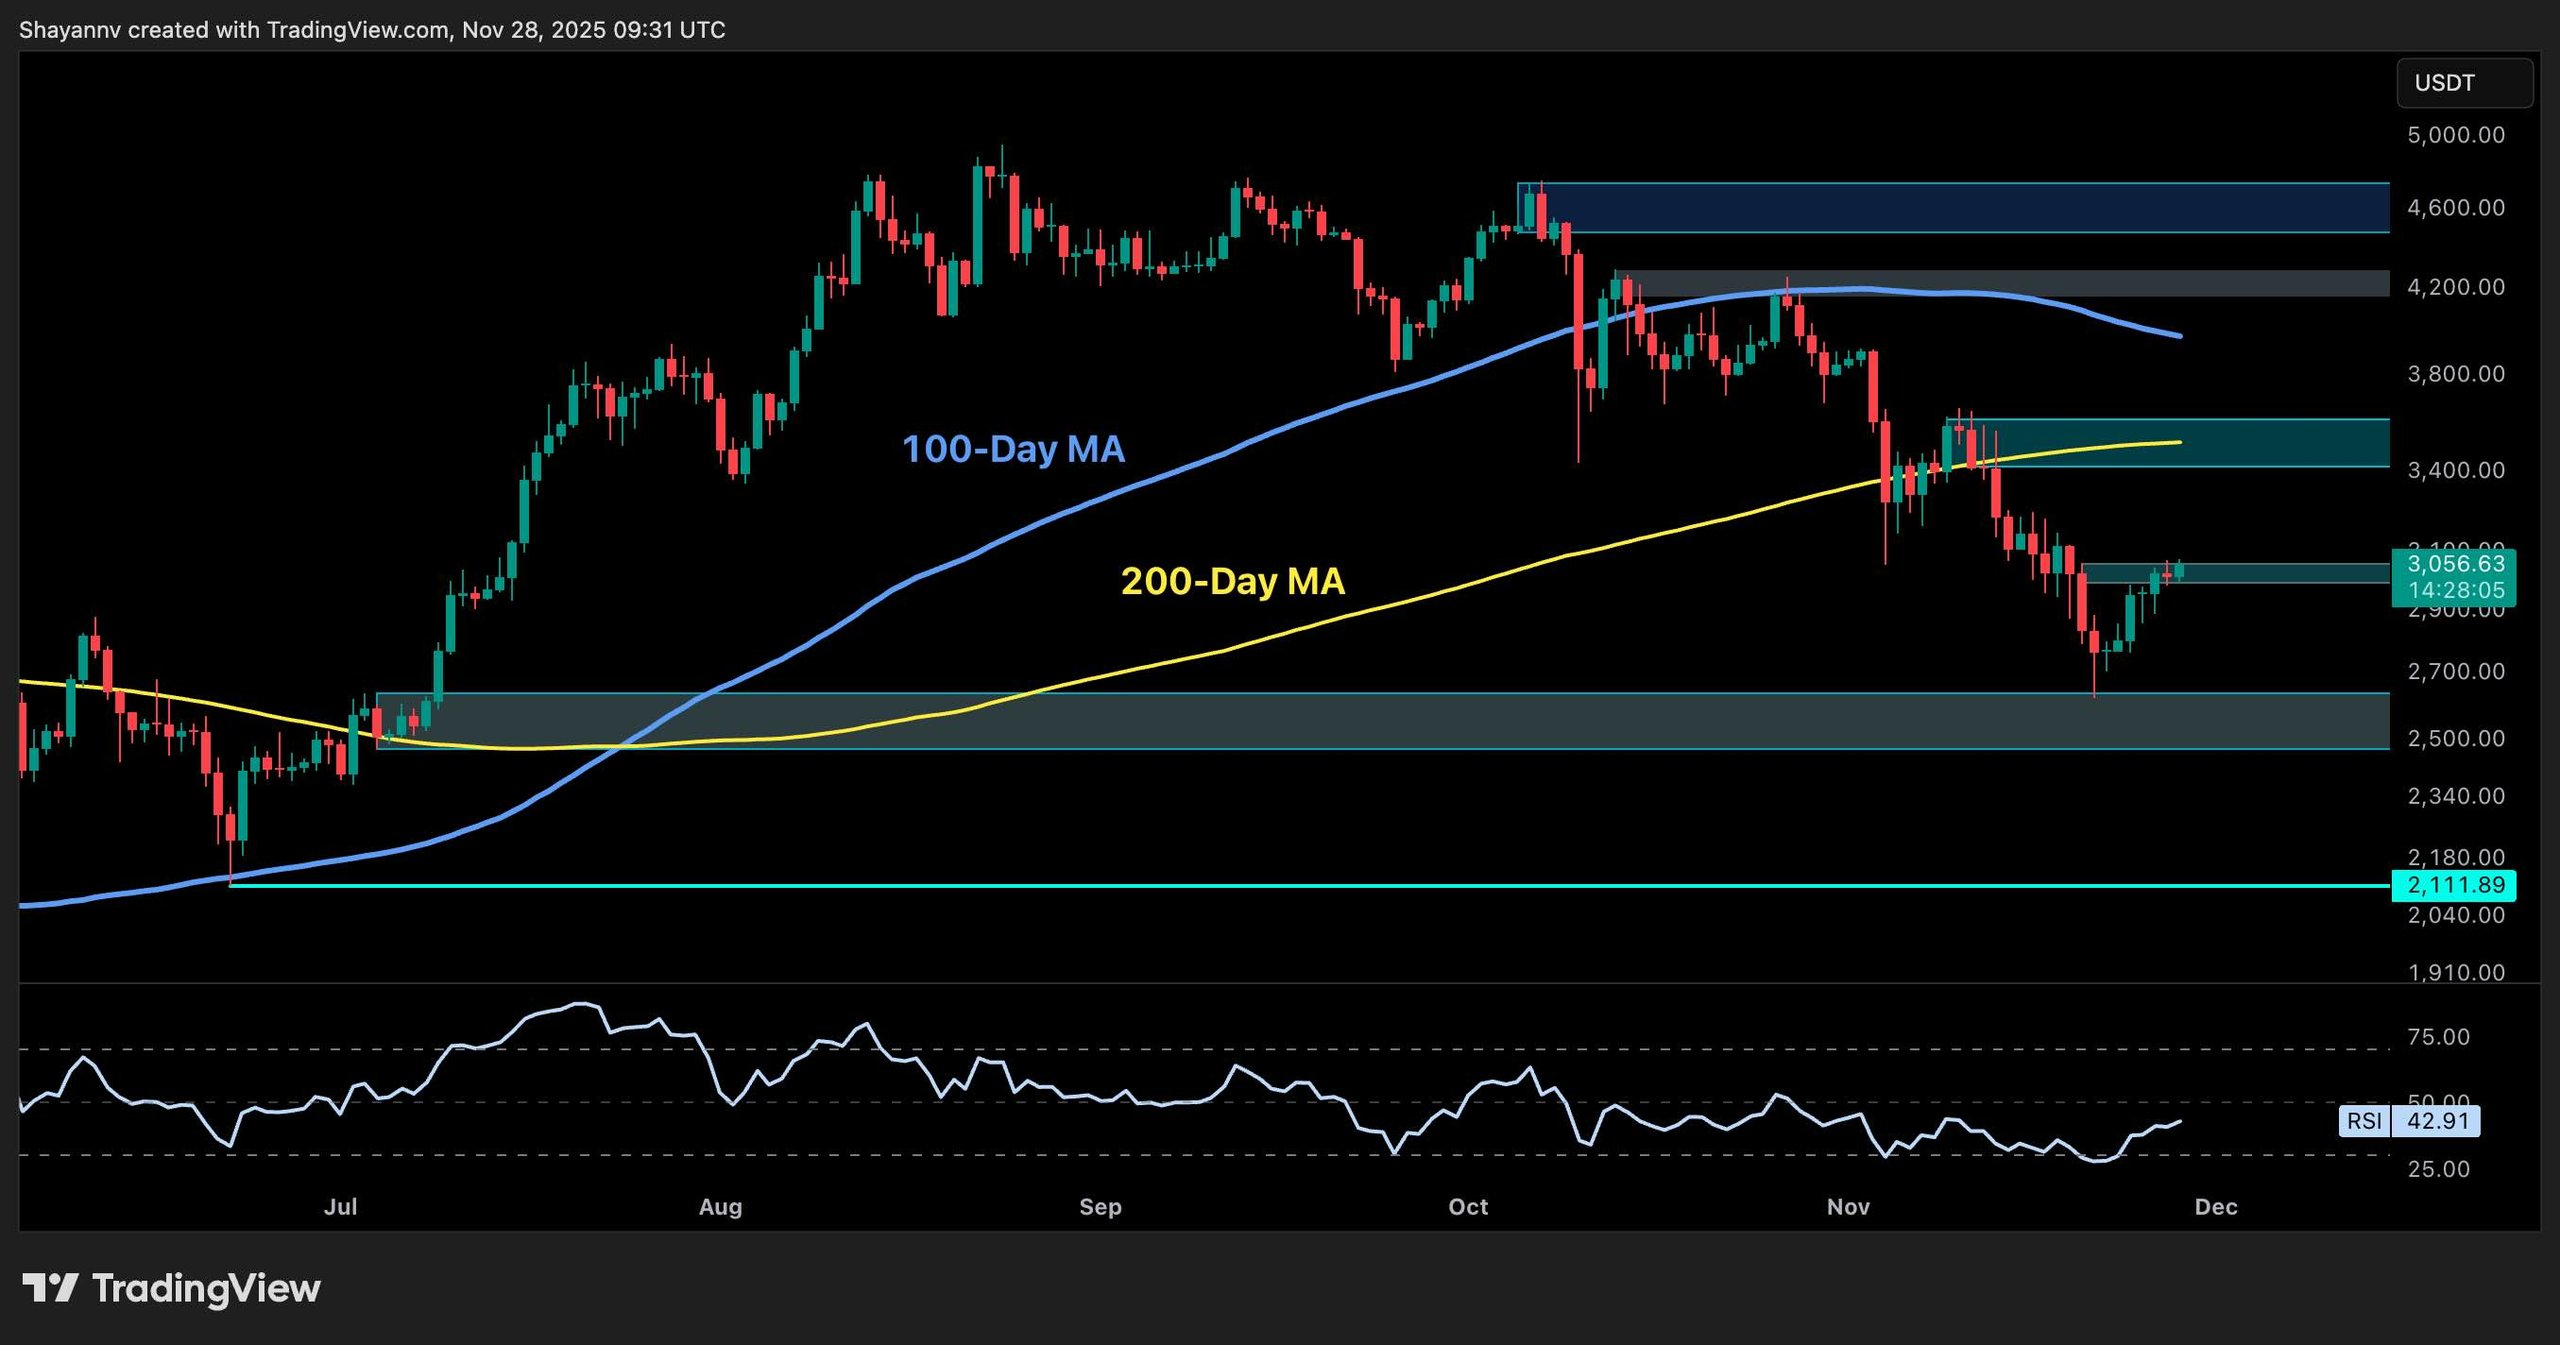
In the daily timeframe, ETH has shown a significant bounce from the $2,600–$2,500 demand zone and is currently hovering just above $3,000, nearing a prior support-turned-resistance zone. This upward movement is leading the price toward the 200-day moving average, positioned around $3,500, which serves as a critical psychological level.
The daily RSI has also emerged from oversold conditions, now recording 42.91, indicating a receding bearish momentum; however, this is still not enough to ascertain a complete reversal.
Structurally, the daily chart reflects lower highs and lower lows. For buyers to effectuate a substantial change, they must surpass the $3,500 range. If the ongoing uptrend falters beneath this resistance, sellers may return aggressively. The $2,500 demand zone remains an essential support level, with $2,100 acting as a crucial last defense.
Daily Chart
4-Hour Chart
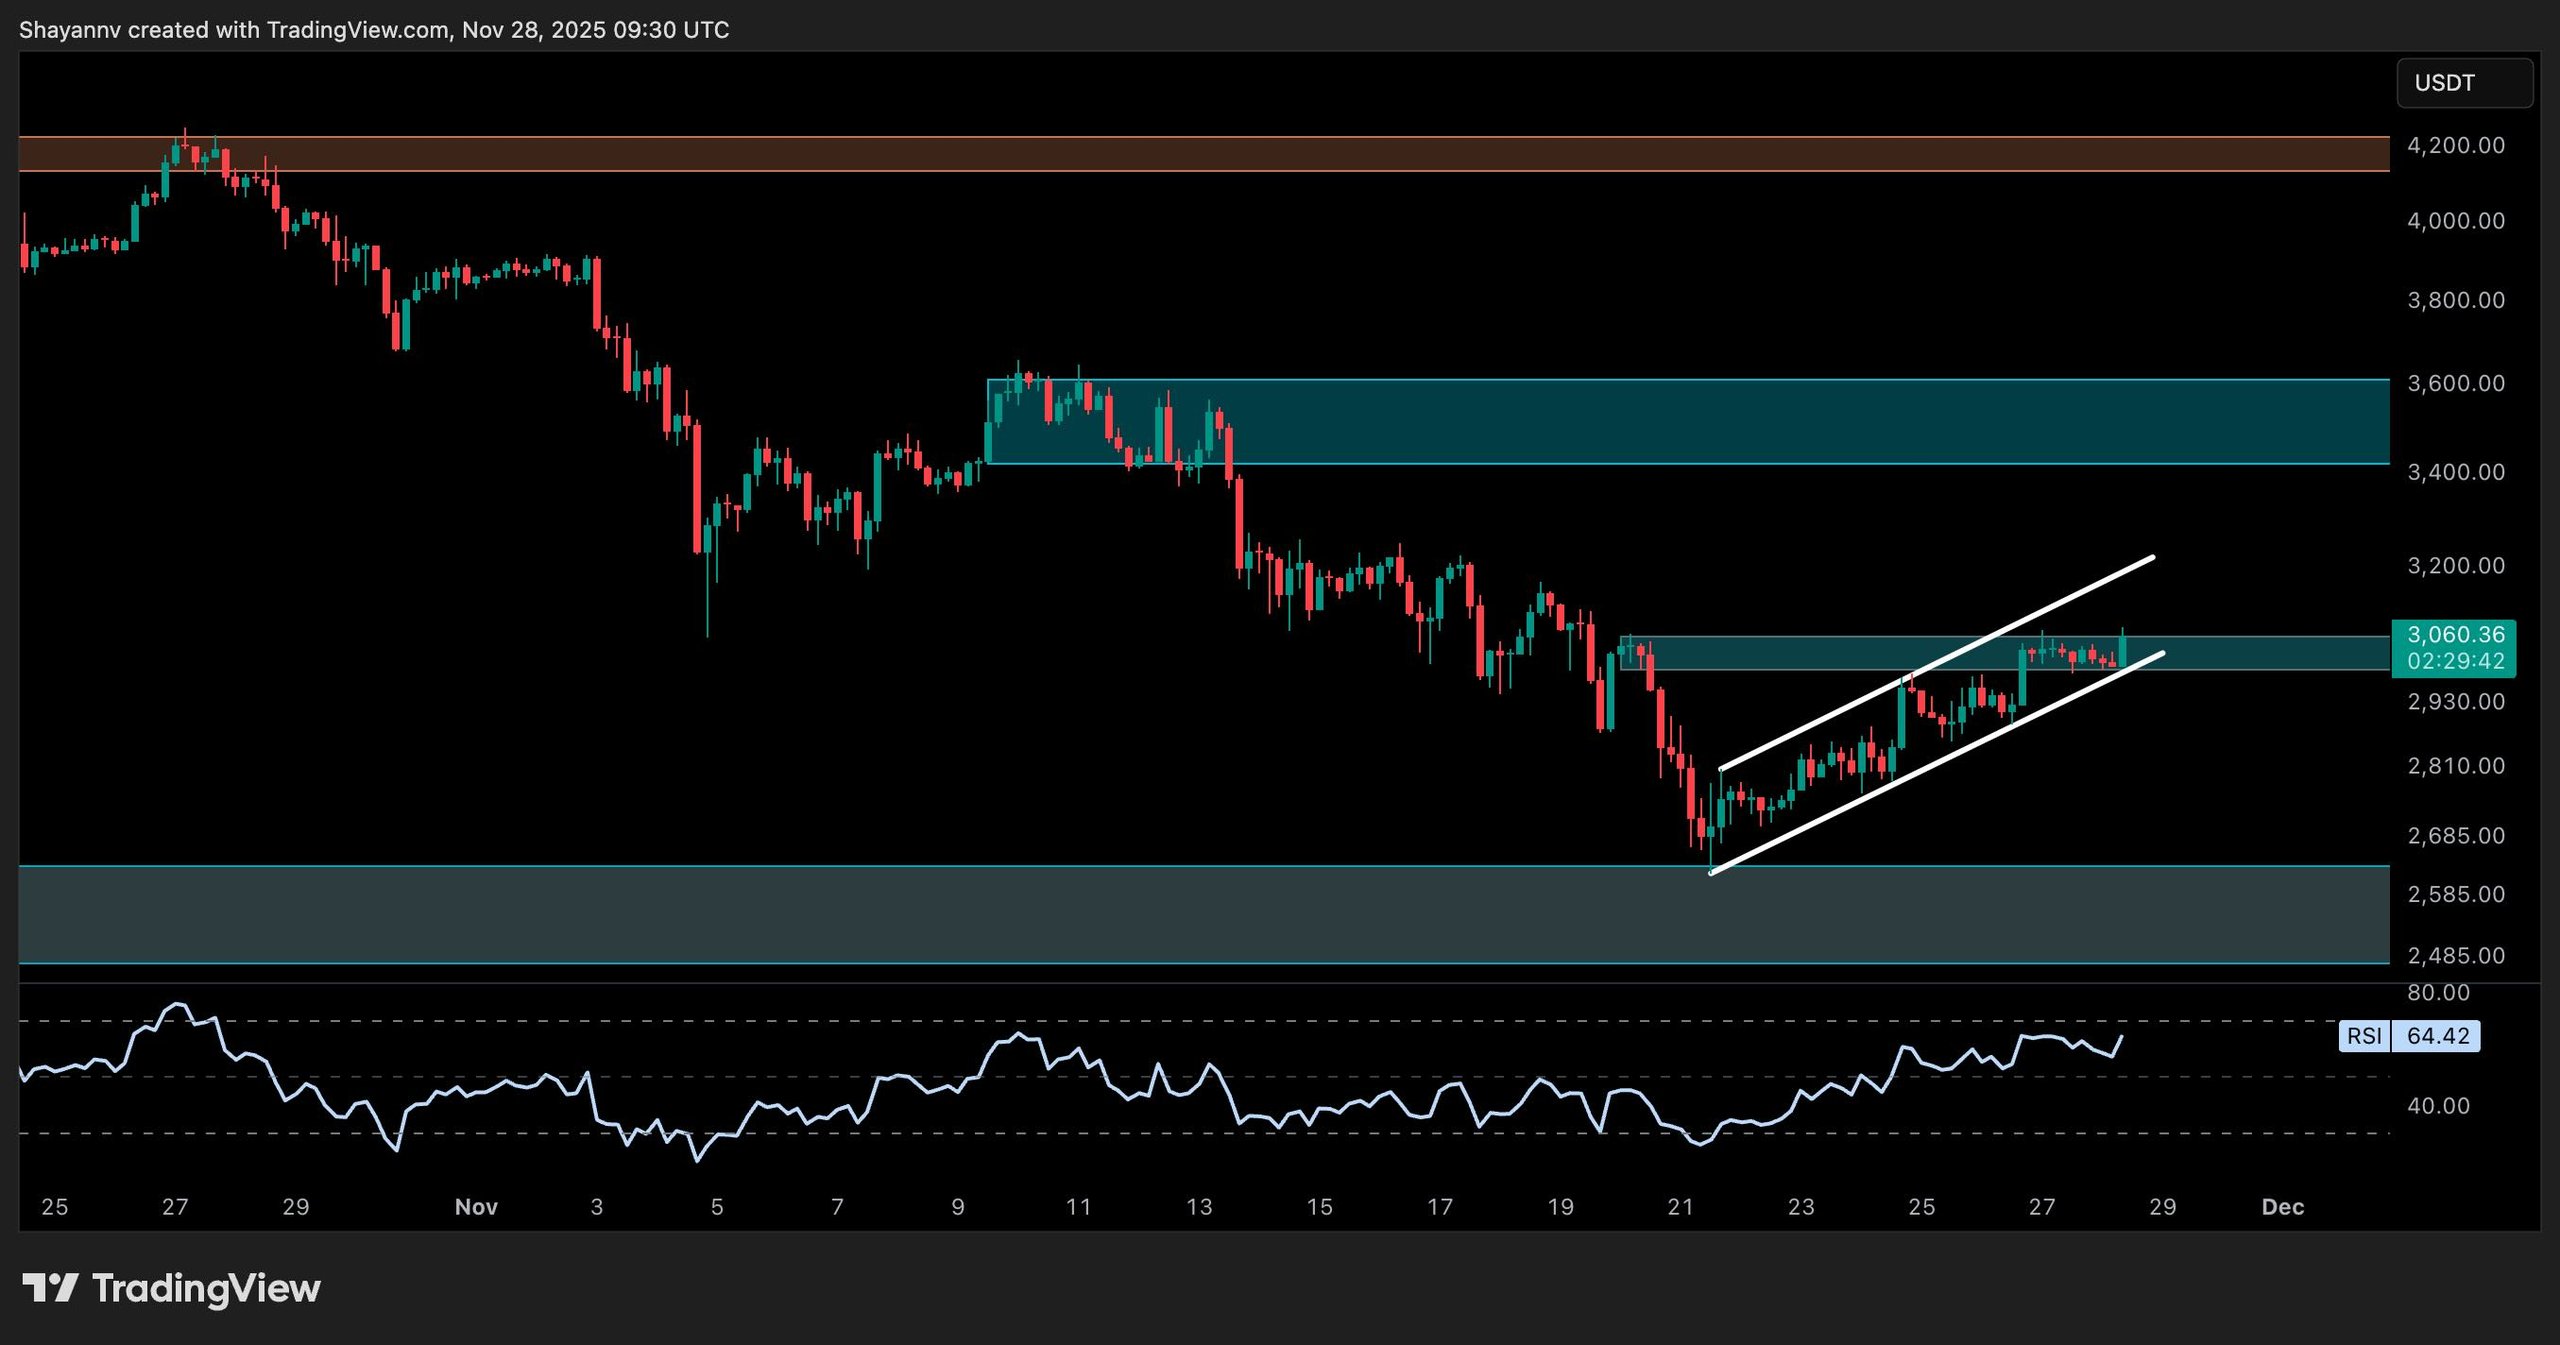
On the 4-hour chart, ETH has been channeling within a defined rising trajectory since bouncing off approximately $2,600, recently engaging with the $3,000 area, aligning with the medium-term resistance zone. Presently, the price action appears to form a bearish flag—a pattern often indicating continuation; however, a breakout above $3,200 could negate the bearish scenario and catalyze movement upwards toward $3,500.
The asset is now consolidating within the resistance band, with the RSI at 64.42, nearing overbought zones, suggesting a possible short-term setback or deceleration.
Conversely, if the flag descends, the immediate level to monitor is the $2,800 short-term low. An inability to maintain that zone could trigger further declines to the $2,500 demand zone.
 4-Hour Chart
On-Chain Analysis
Exchange Reserve
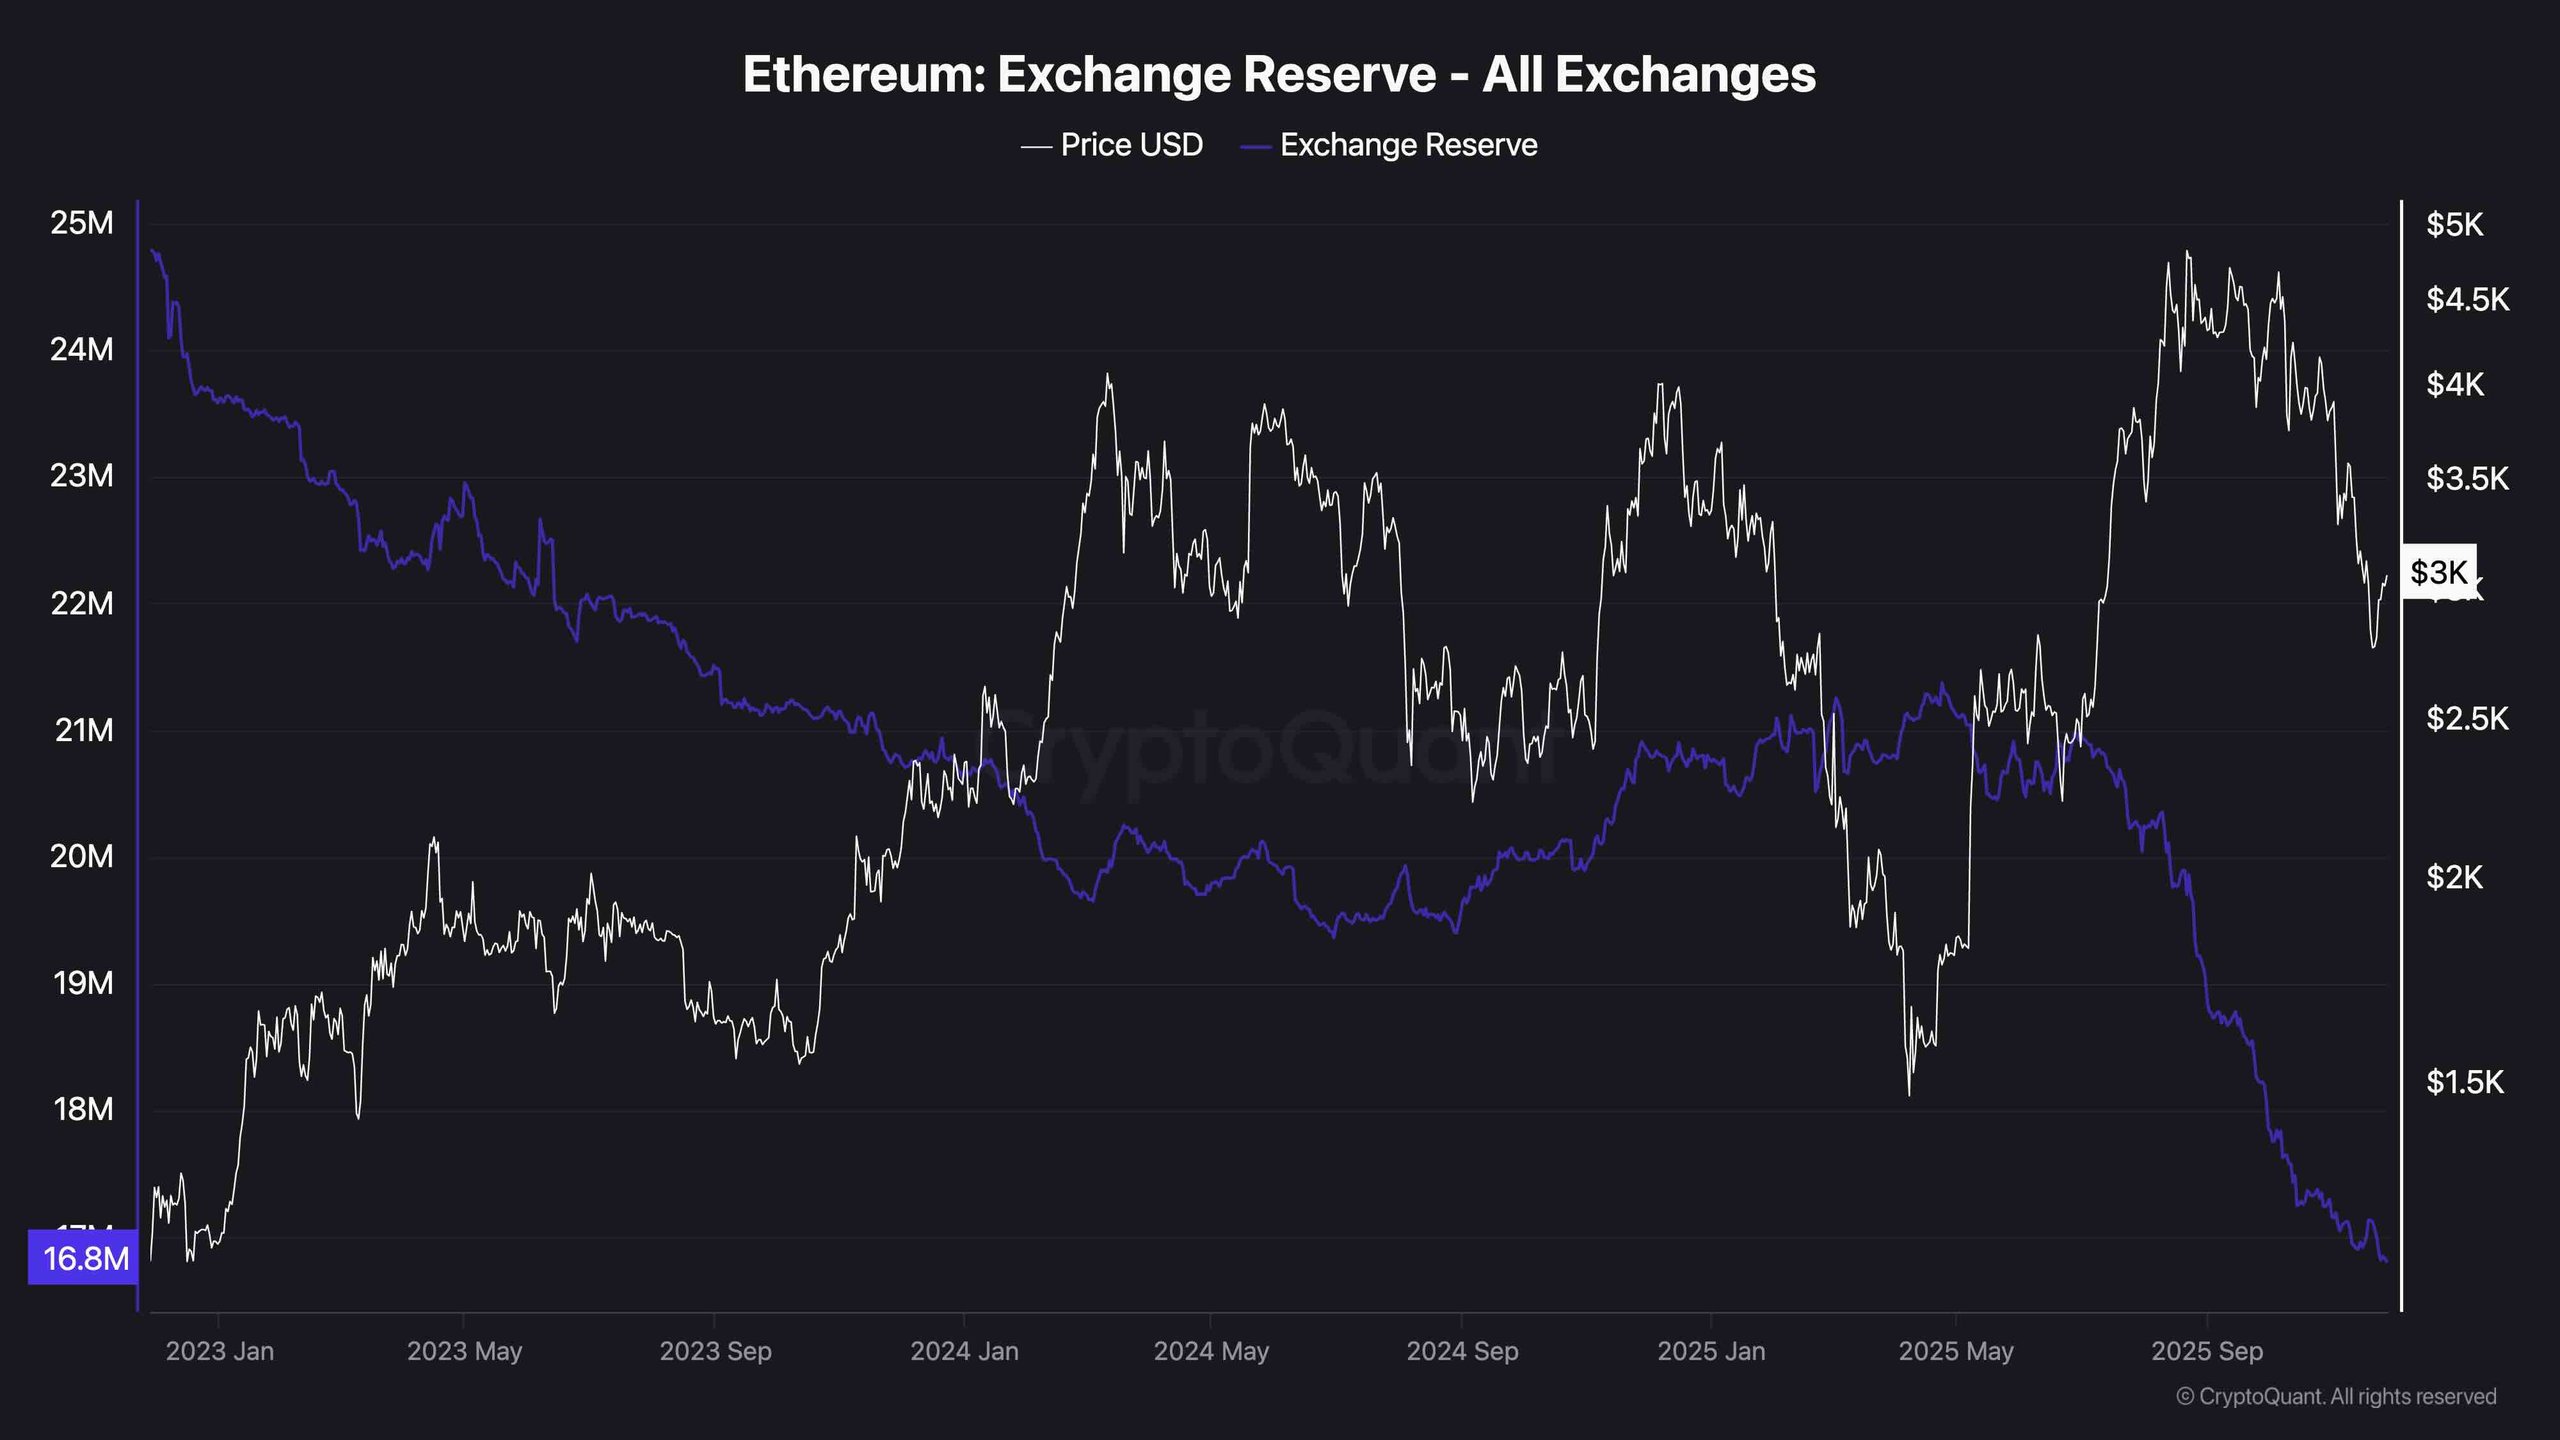
From an on-chain viewpoint, Ethereum’s exchange reserves are on a steep decline, reaching a multi-year low of approximately 16.8 million ETH. This ongoing outflow from trading platforms signals a robust long-term bullish sentiment, as investors are increasingly opting to transfer their assets into cold storage or staking instead of making preparations to sell.
Historically, such supply contractions within centralized exchanges have often predated major price surges, though the timing of these movements can be unpredictable. This supply dynamic contributes positively to Ethereum’s long-term outlook, especially if macroeconomic risk factors begin to subside.
 Exchange Reserve
