Bitcoin Price Insights: Is BTC Turning Bullish After Surpassing $90K?
An analysis of Bitcoin's recent price movements, examining key support and resistance levels.


Bitcoin Price Insights: Is BTC Turning Bullish After Surpassing $90K?
Bitcoin has seen a surge of interest from buyers as it bounces off a crucial support zone, pushing prices higher towards a short-term supply range. However, despite this rebound, the overarching market sentiment remains bearish. The latest surge should be interpreted as a short-term relief unless Bitcoin manages to establish stability above the $100K mark.
Technical Analysis
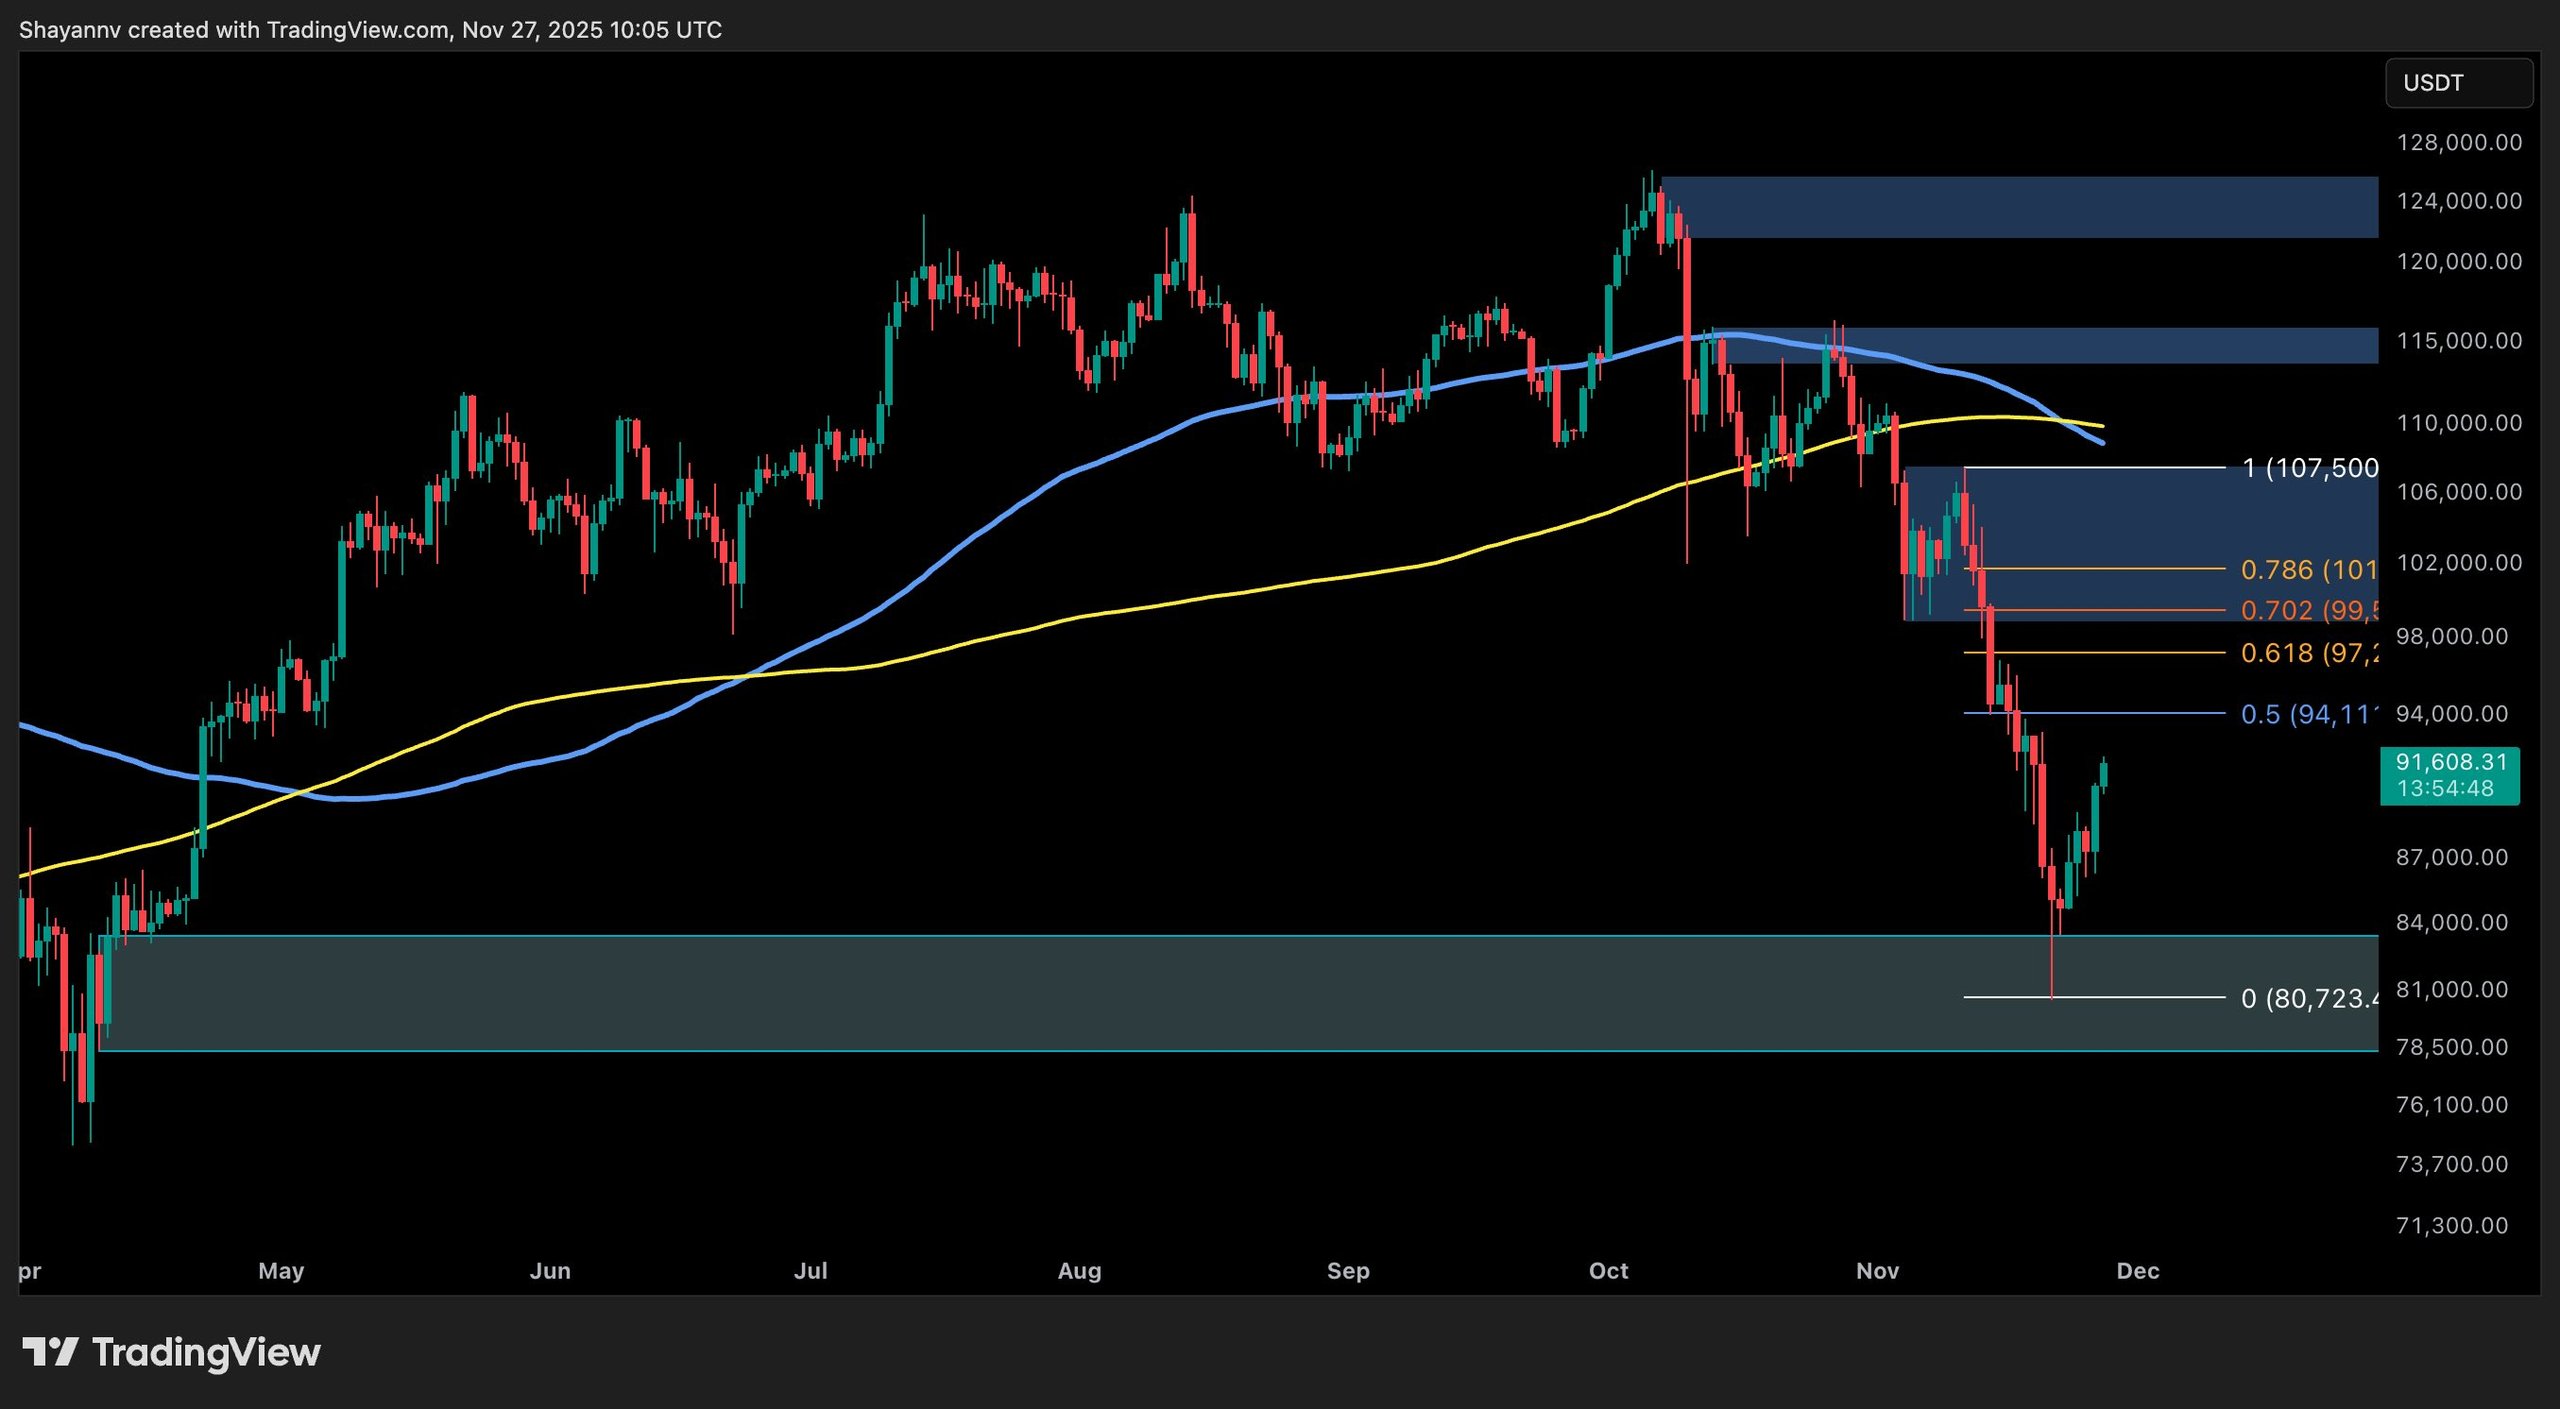
The Daily Chart
Recent activity indicates a notable increase in purchasing near the $80K support, prompting a significant upward movement. This suggests that buyers are entering the market at lower prices while the general mood has been characterized by fear.
Nevertheless, several resistance points loom. The initial significant level is around $96K. If buyers can gain ground beyond this level, a further retest of the $100K to $104K range is anticipated. Conversely, failure to reclaim this range could lead Bitcoin to retreat into the $80K - $83K accumulation zone, reflecting long-standing buyer engagement.
Bitcoin Daily Chart
The 4-Hour Chart
In the previous weeks, Bitcoin experienced a downward trend fostering market apprehension. Recently, however, the price broke through a declining trendline, showcasing renewed demand in the market against the backdrop of earlier selling pressure.
Currently, Bitcoin faces significant resistances at:
- The $91K supply region
- The descending trendline that has constrained price increases during its decline
This zone is critical; failure at this resistance could push Bitcoin back towards the $80K support level. A successful breakout could indeed catapult prices toward $100K, shifting the market towards buyer momentum.
 Bitcoin 4H Chart
On-chain Analysis
Current on-chain metrics reveal Bitcoin trading below a cluster of liquidation points, particularly under the $100K psychological barrier. This indicates concentrations of short positions that may quickly reverse, leading to excessive downward movement during past volatility phases, ultimately targeting liquidity above current prices.
The heatmap illustrates large liquidity gaps leading into the $80K - $85K zone, aligning with pivotal daily decision points. Should Bitcoin revisit this area, how effectively the market handles these liquidity pockets will shape whether a significant low forms.
 Binance BTCUSDT Liquidation Heatmap
As liquidity tightens above and substantial unfilled spaces persist below the price, Bitcoin stands at a decisive turning point. A potential final capitulation to the demand zone may occur, but historically, such liquidity-induced flushes have preceded strong recovery phases.
