
Signs of a Major Bitcoin Downturn: Will BTC Price Hit $68,000?
Recent on-chain data suggests Bitcoin may be facing a significant decline, reminiscent of its trajectory in 2022.


Bitcoin is showing early indicators of a potential deeper correction, with its recent recovery stagnating at $93,000. According to analysis, Bitcoin’s market structure increasingly resembles early 2022, which was the beginning of the bear market.
Key Takeaways:
- Bitcoin’s on-chain structure mirrors early 2022, risking a deep bear market if key levels are lost.
- Bitcoin’s bear flag targets a price of $68,100.
Bitcoin On-Chain Data Suggests Early Bear Market
Bitcoin has dropped and found support near its True Market Mean of $81,500, as noted by on-chain data provider Glassnode. This mean reflects the cost basis of non-dormant coins, excluding miners.
“This level often represents the divide between a mild bearish phase and a significant bear market,” Glassnode stated in their latest report, adding,
“While the price has recently stabilized above this level, the overall market structure increasingly reflects the dynamics of Q1 2022.”
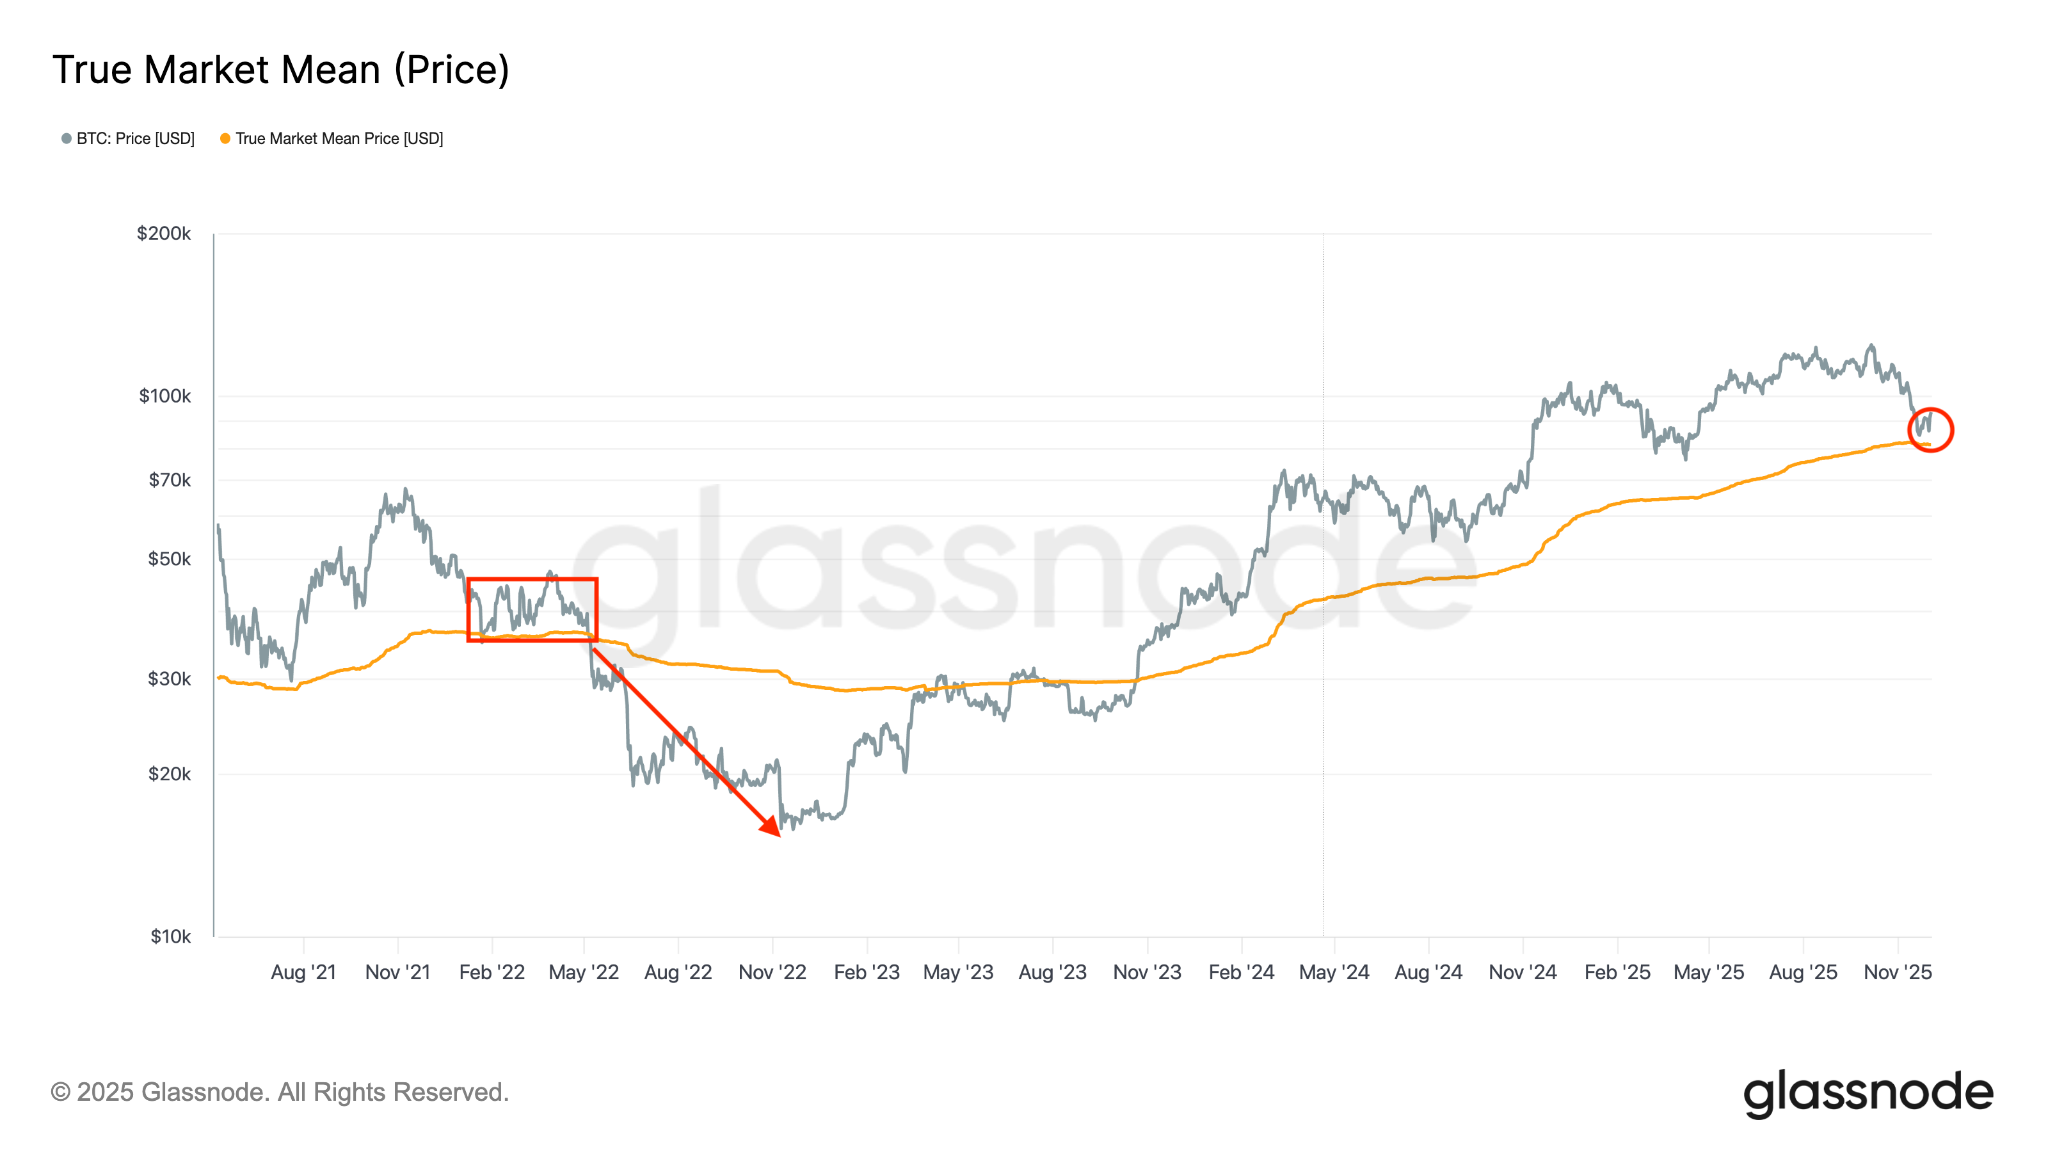 Bitcoin: True Market Mean. Source: Glassnode
The chart indicates that the BTC/USD pair traded above this threshold from January 22 to May 5, 2022. After dropping below this level on May 6, the price fell further by 61%, eventually bottoming at $15,500 in November.
The observations align with a Supply Quantiles Cost Basis model, which tracks the entry price of major coin clusters. Since mid-November, Bitcoin’s price has dipped below the 0.75 quantile, now trading near $96,100, leaving over 25% of supply below water.
This situation creates a delicate balance between the risk of top-buyer capitulation and the possibility of seller exhaustion forming a bottom, as Glassnode noted: “The current structure remains highly sensitive to macro shocks until the market can reclaim the 0.85 quantile (~$106.2K) as support.”

The CryptoQuant Bull Score Index shows a bearish view after dropping sharply since August, with a reading remaining flat throughout November despite short-term price volatility. Currently, it rests within the 0–20 range, signaling deep bearish conditions similar to those in January 2022 as depicted below:
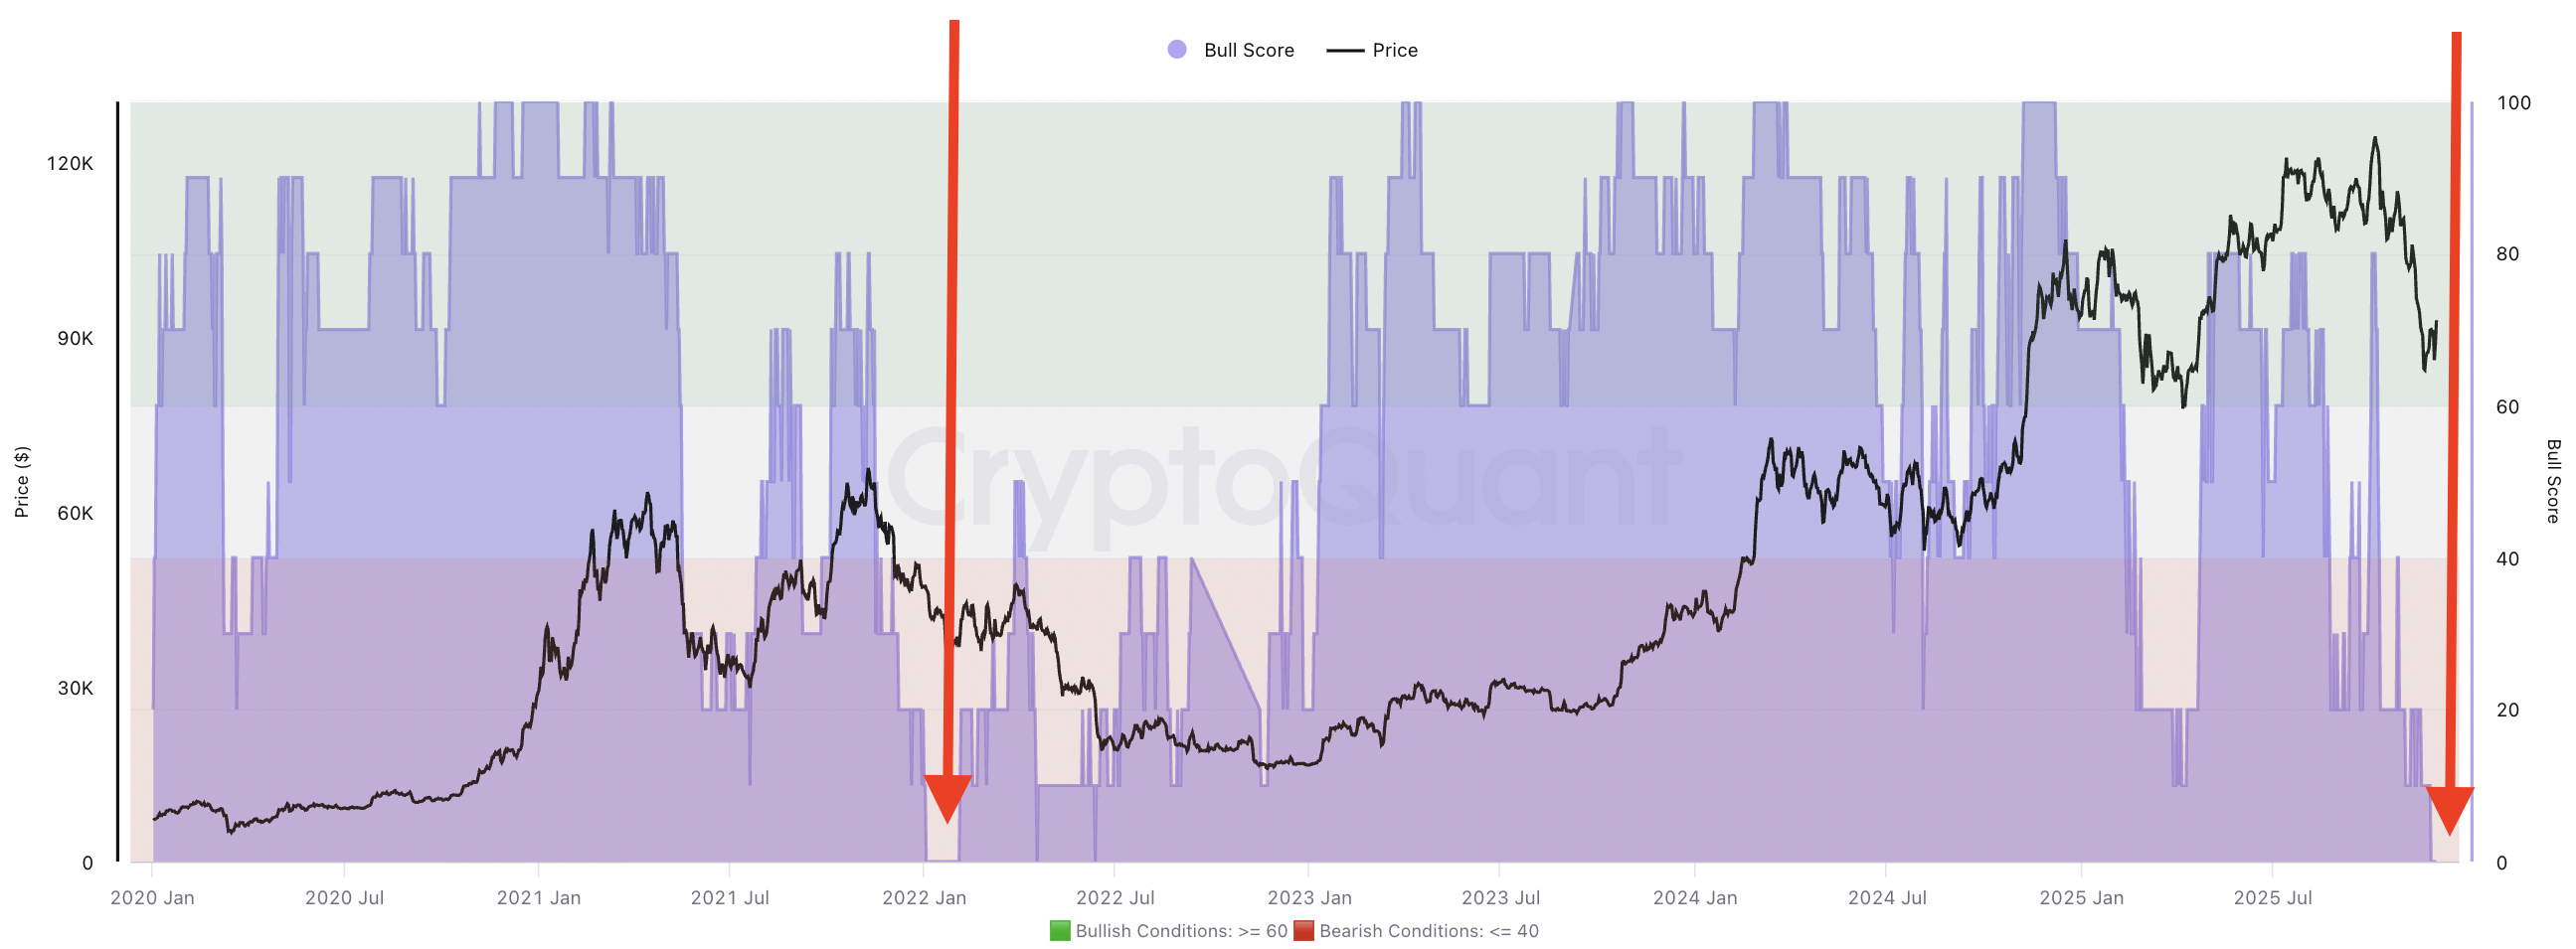 Bitcoin: Bull Score Index. Source: CryptoQuant
As previously reported, Bitcoin’s price actions bear resemblance to those of the 2022 bear market.
Bitcoin’s Bear Flag Targets $69,000
The recent recovery attempt of Bitcoin faced robust resistance around $93,000, as reported by both Cointelegraph Markets Pro and TradingView. This resistance level aligns with the yearly open and the upper limit of a bear flag.
A break below the flag’s lower boundary at $91,000 would validate the bear flag, opening the possibility for a fresh downtrend toward the measured target of $68,150.
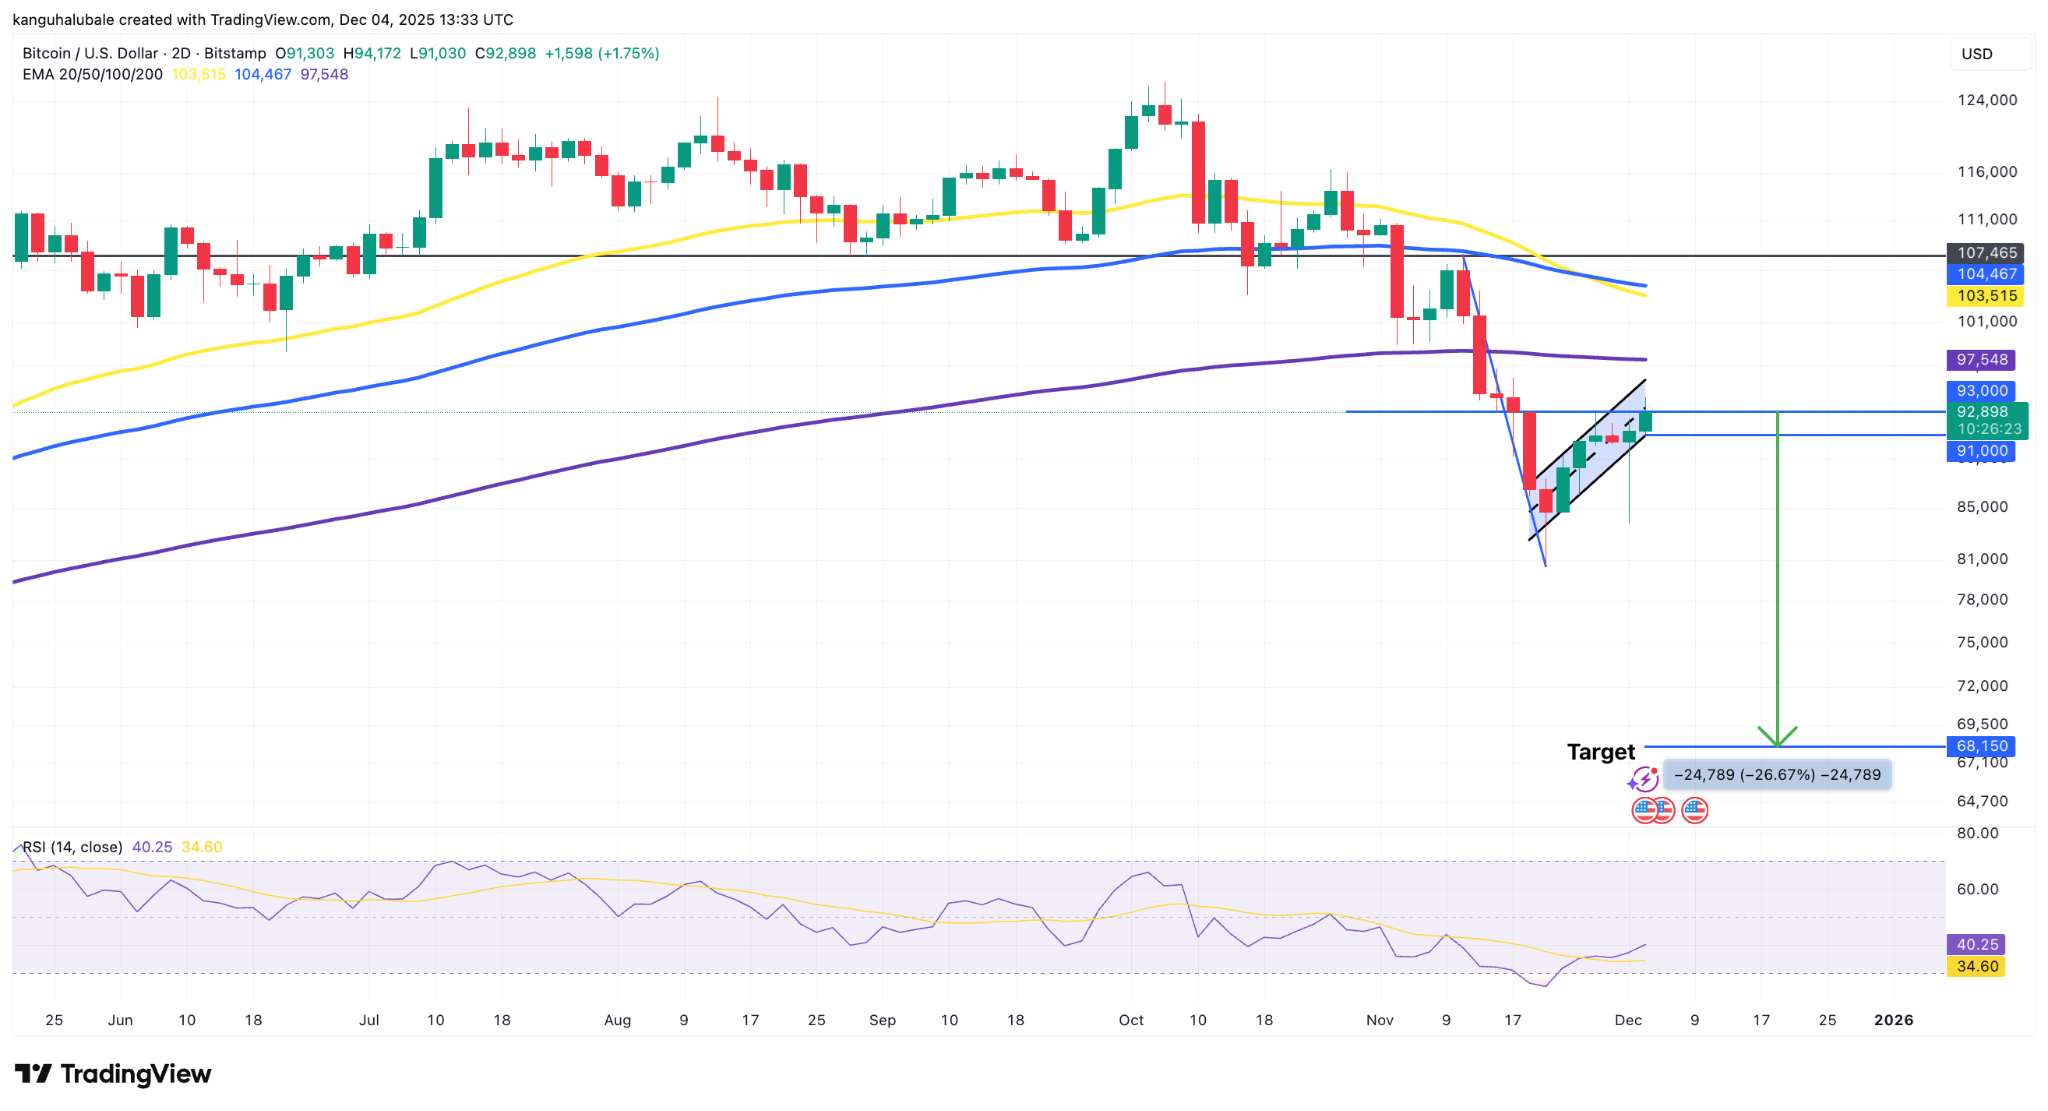 BTC/USD two-day chart. Source: Cointelegraph/TradingView
Momentum indicators, including the Relative Strength Index (RSI), remain low at 40, indicating that market dynamics still lean towards the downside.
As previously noted, the bearish trend will be overturned if bulls manage to increase the price above $96,000, supported by a positive Coinbase Premium.
This article does not offer investment advice or recommendations. All investment and trading moves involve risk; therefore, readers are encouraged to perform their own research.
