Ethereum Price Forecast: Is ETH Facing Trouble Following Another $3K Rejection?
Ethereum is in a critical phase with its price caught between resistance and demand, signaling a potential upcoming price movement.


Ethereum finds itself in a compression phase, with its price movements tightening between declining resistance and a defined demand zone. This situation suggests that Ethereum (ETH) is nearing a pivotal moment where significant price movement could follow the current constriction.
Ethereum Price Analysis: The Daily Chart
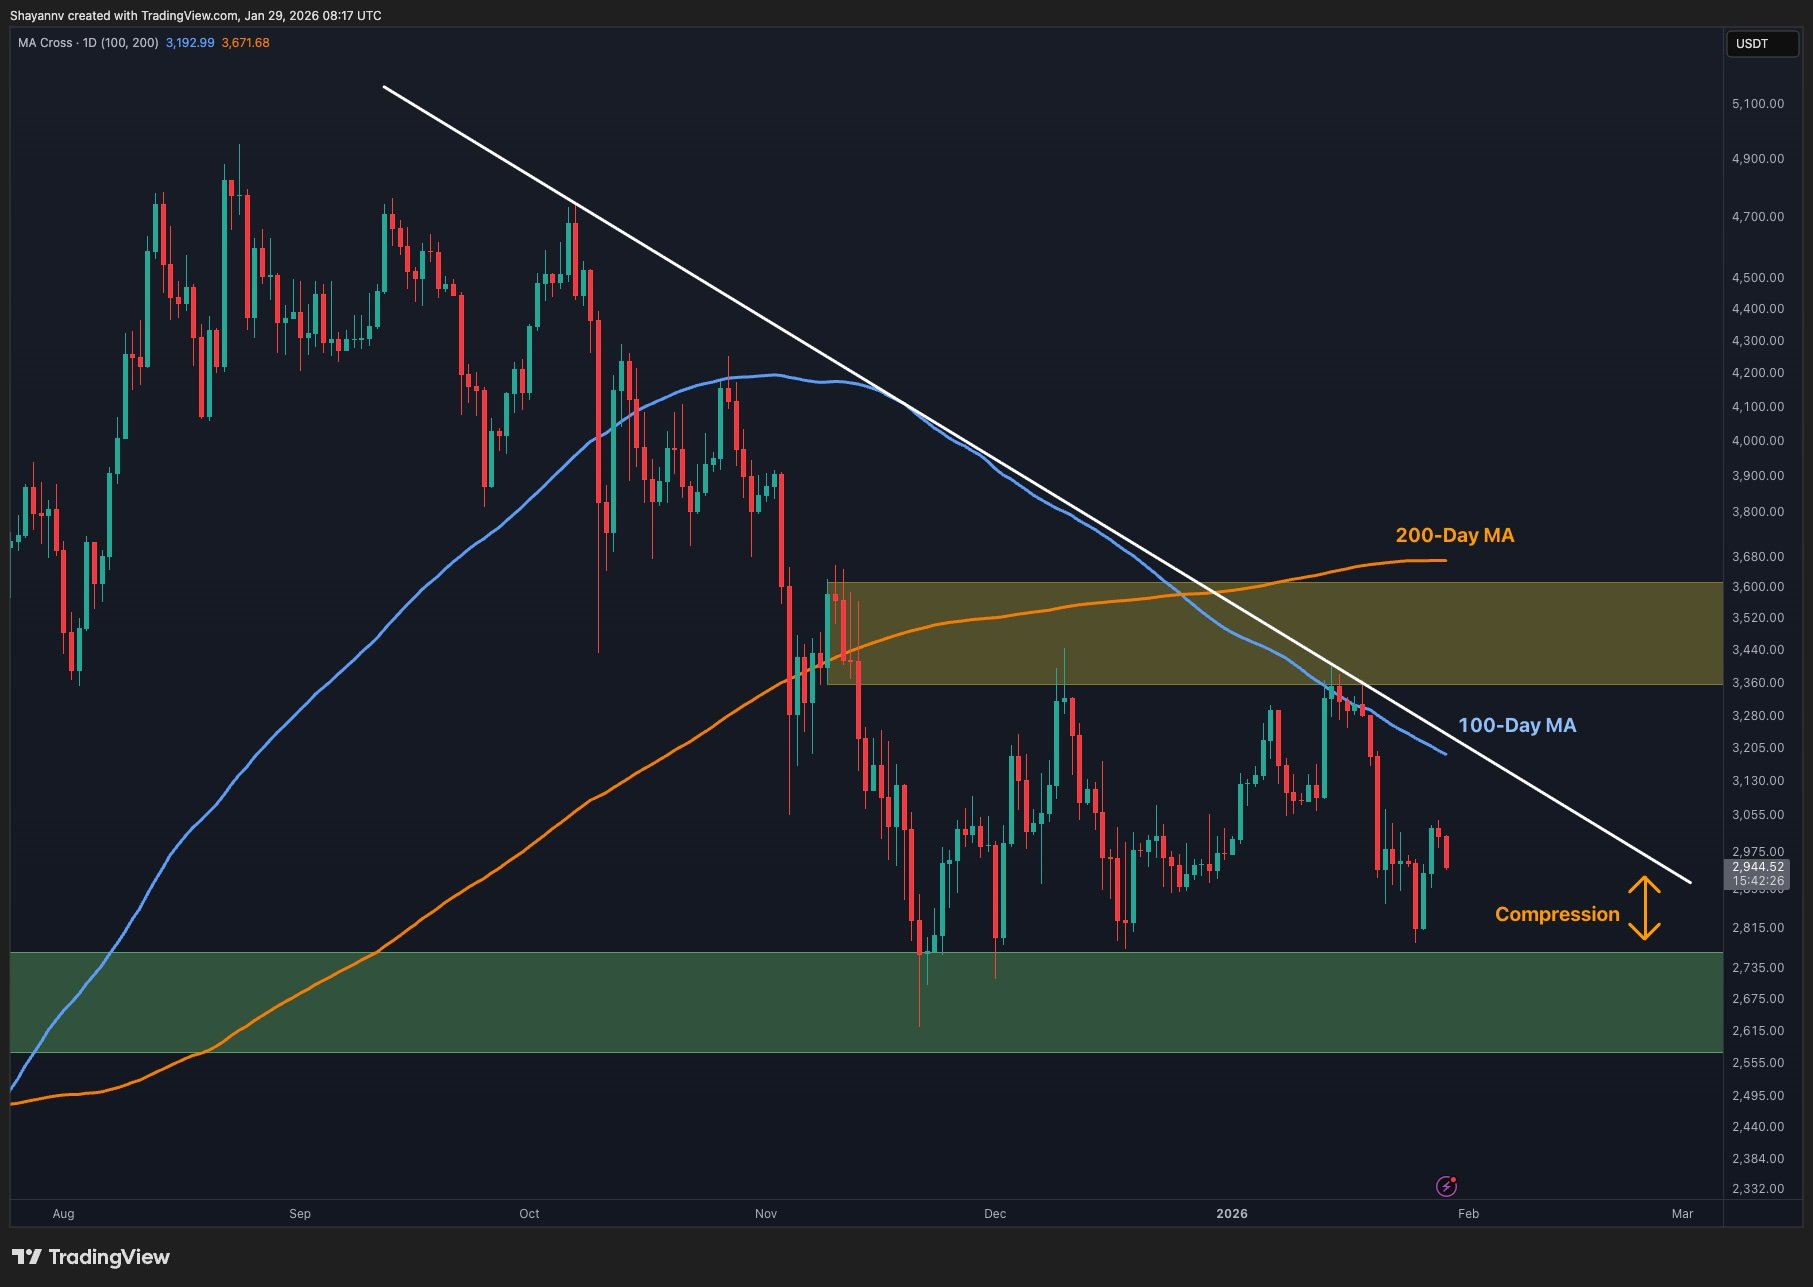
At the daily level, Ethereum is trading beneath a prominent descending trendline that has constrained its price since the last significant high. Various rejections of this trendline indicate its importance as a main dynamic resistance. Currently, ETH trades below the 100-day and 200-day moving averages, with the 100-day MA at $3.1K already trending downward, adding bearish pressure to the price, while the 200-day MA remains higher and continues to act as a broader trend filter.
The resistance zone created by the descending trendline and the moving averages has continuously absorbed bullish attempts, signaling ongoing selling pressure at elevated levels. Conversely, bearish momentum appears to be slowing as prices near a well-defined demand area around the $2.7K threshold, a zone that has previously generated robust market reactions, indicating that buyers are still willing to defend these levels.
Overall, the daily chart highlights more of a contracting structure rather than a continuation of trends. As the price fluctuates between descending resistance and rising demand, it appears that the market is consolidating into a reduced range, heightening the likelihood of a larger directional swing once this balance breaks.
Ethereum Daily Chart
ETH/USDT 4-Hour Chart
In the 4-hour time frame, this compression is even clearer. Ethereum is moving between the downward resistance line and an upward support line, creating an evident wedge pattern. Recent price activity shows ETH rebounding from the lower edge of the wedge around $2.8K, confirming buyer interest at these lower levels.
Despite the bounce, Ethereum is still hindered below the internal resistance zone at $3K, lacking a significant breakout above the upper edge of the wedge. This absence of follow-through suggests that bullish momentum remains weak and reactive. Until Ethereum can establish and sustain support above the descending resistance with strong buy-in, upward movements are likely to be corrective.
The current pattern suggests potential expansion, but direction remains contingent upon market behavior. A decisive breakout above the wedge would shift market control back to buyers, while rejection near resistance could lead to another retreat toward the demand zone.
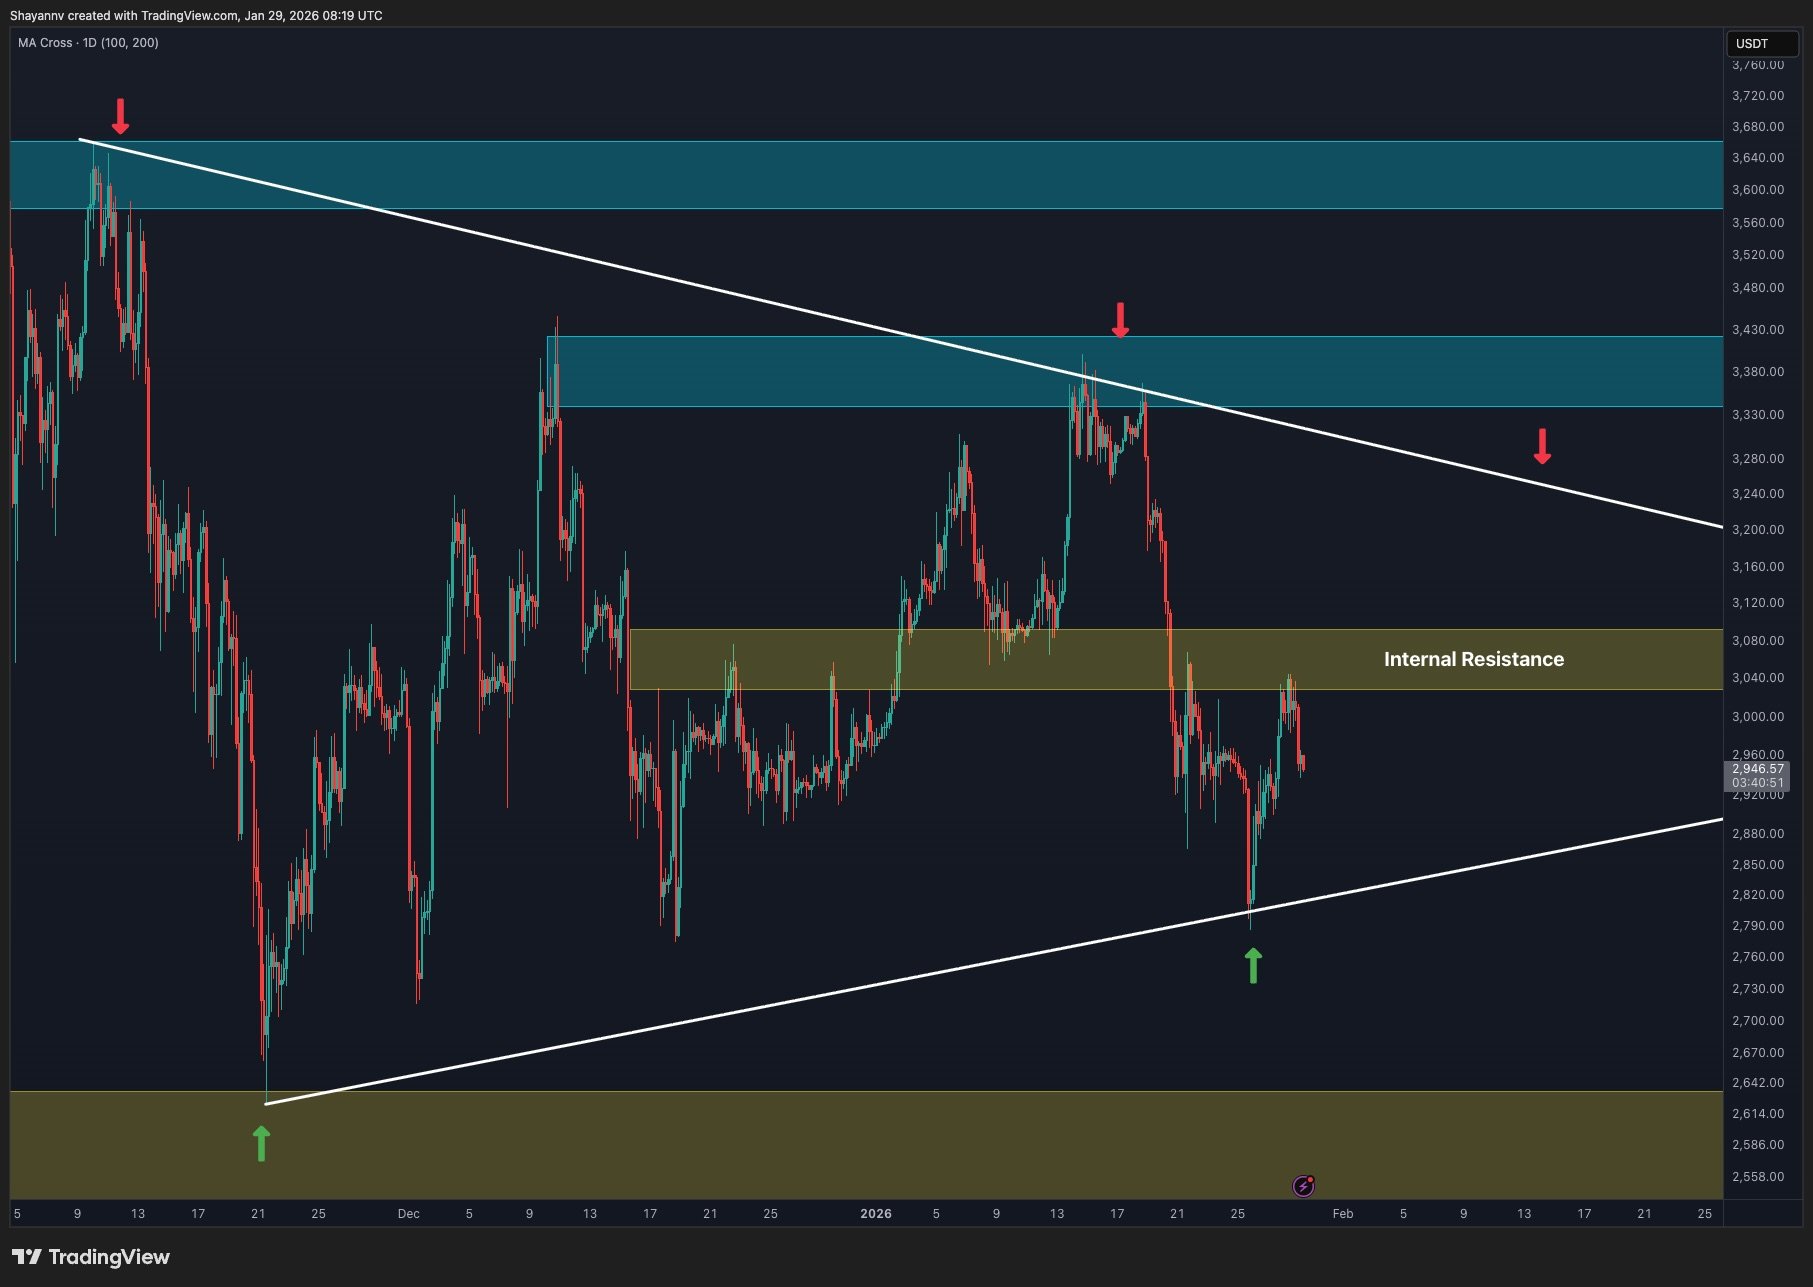 Ethereum 4-Hour Chart
Sentiment Analysis
The liquidation heatmap reveals substantial liquidity pockets resting above the current price at the $3.1K level, particularly heavy concentrations overhead. This suggests that a movement into this resistance could trigger cascading liquidations on the short side, while dips into lower liquidity pools may serve to rebalance positions ahead of larger directional moves.
Overall, Ethereum seems to be in the late stages of compression in both its price structure and derivative positioning. The clarity of direction will depend on how ETH reacts to the descending resistance and whether liquidity is absorbed above or below the current range.
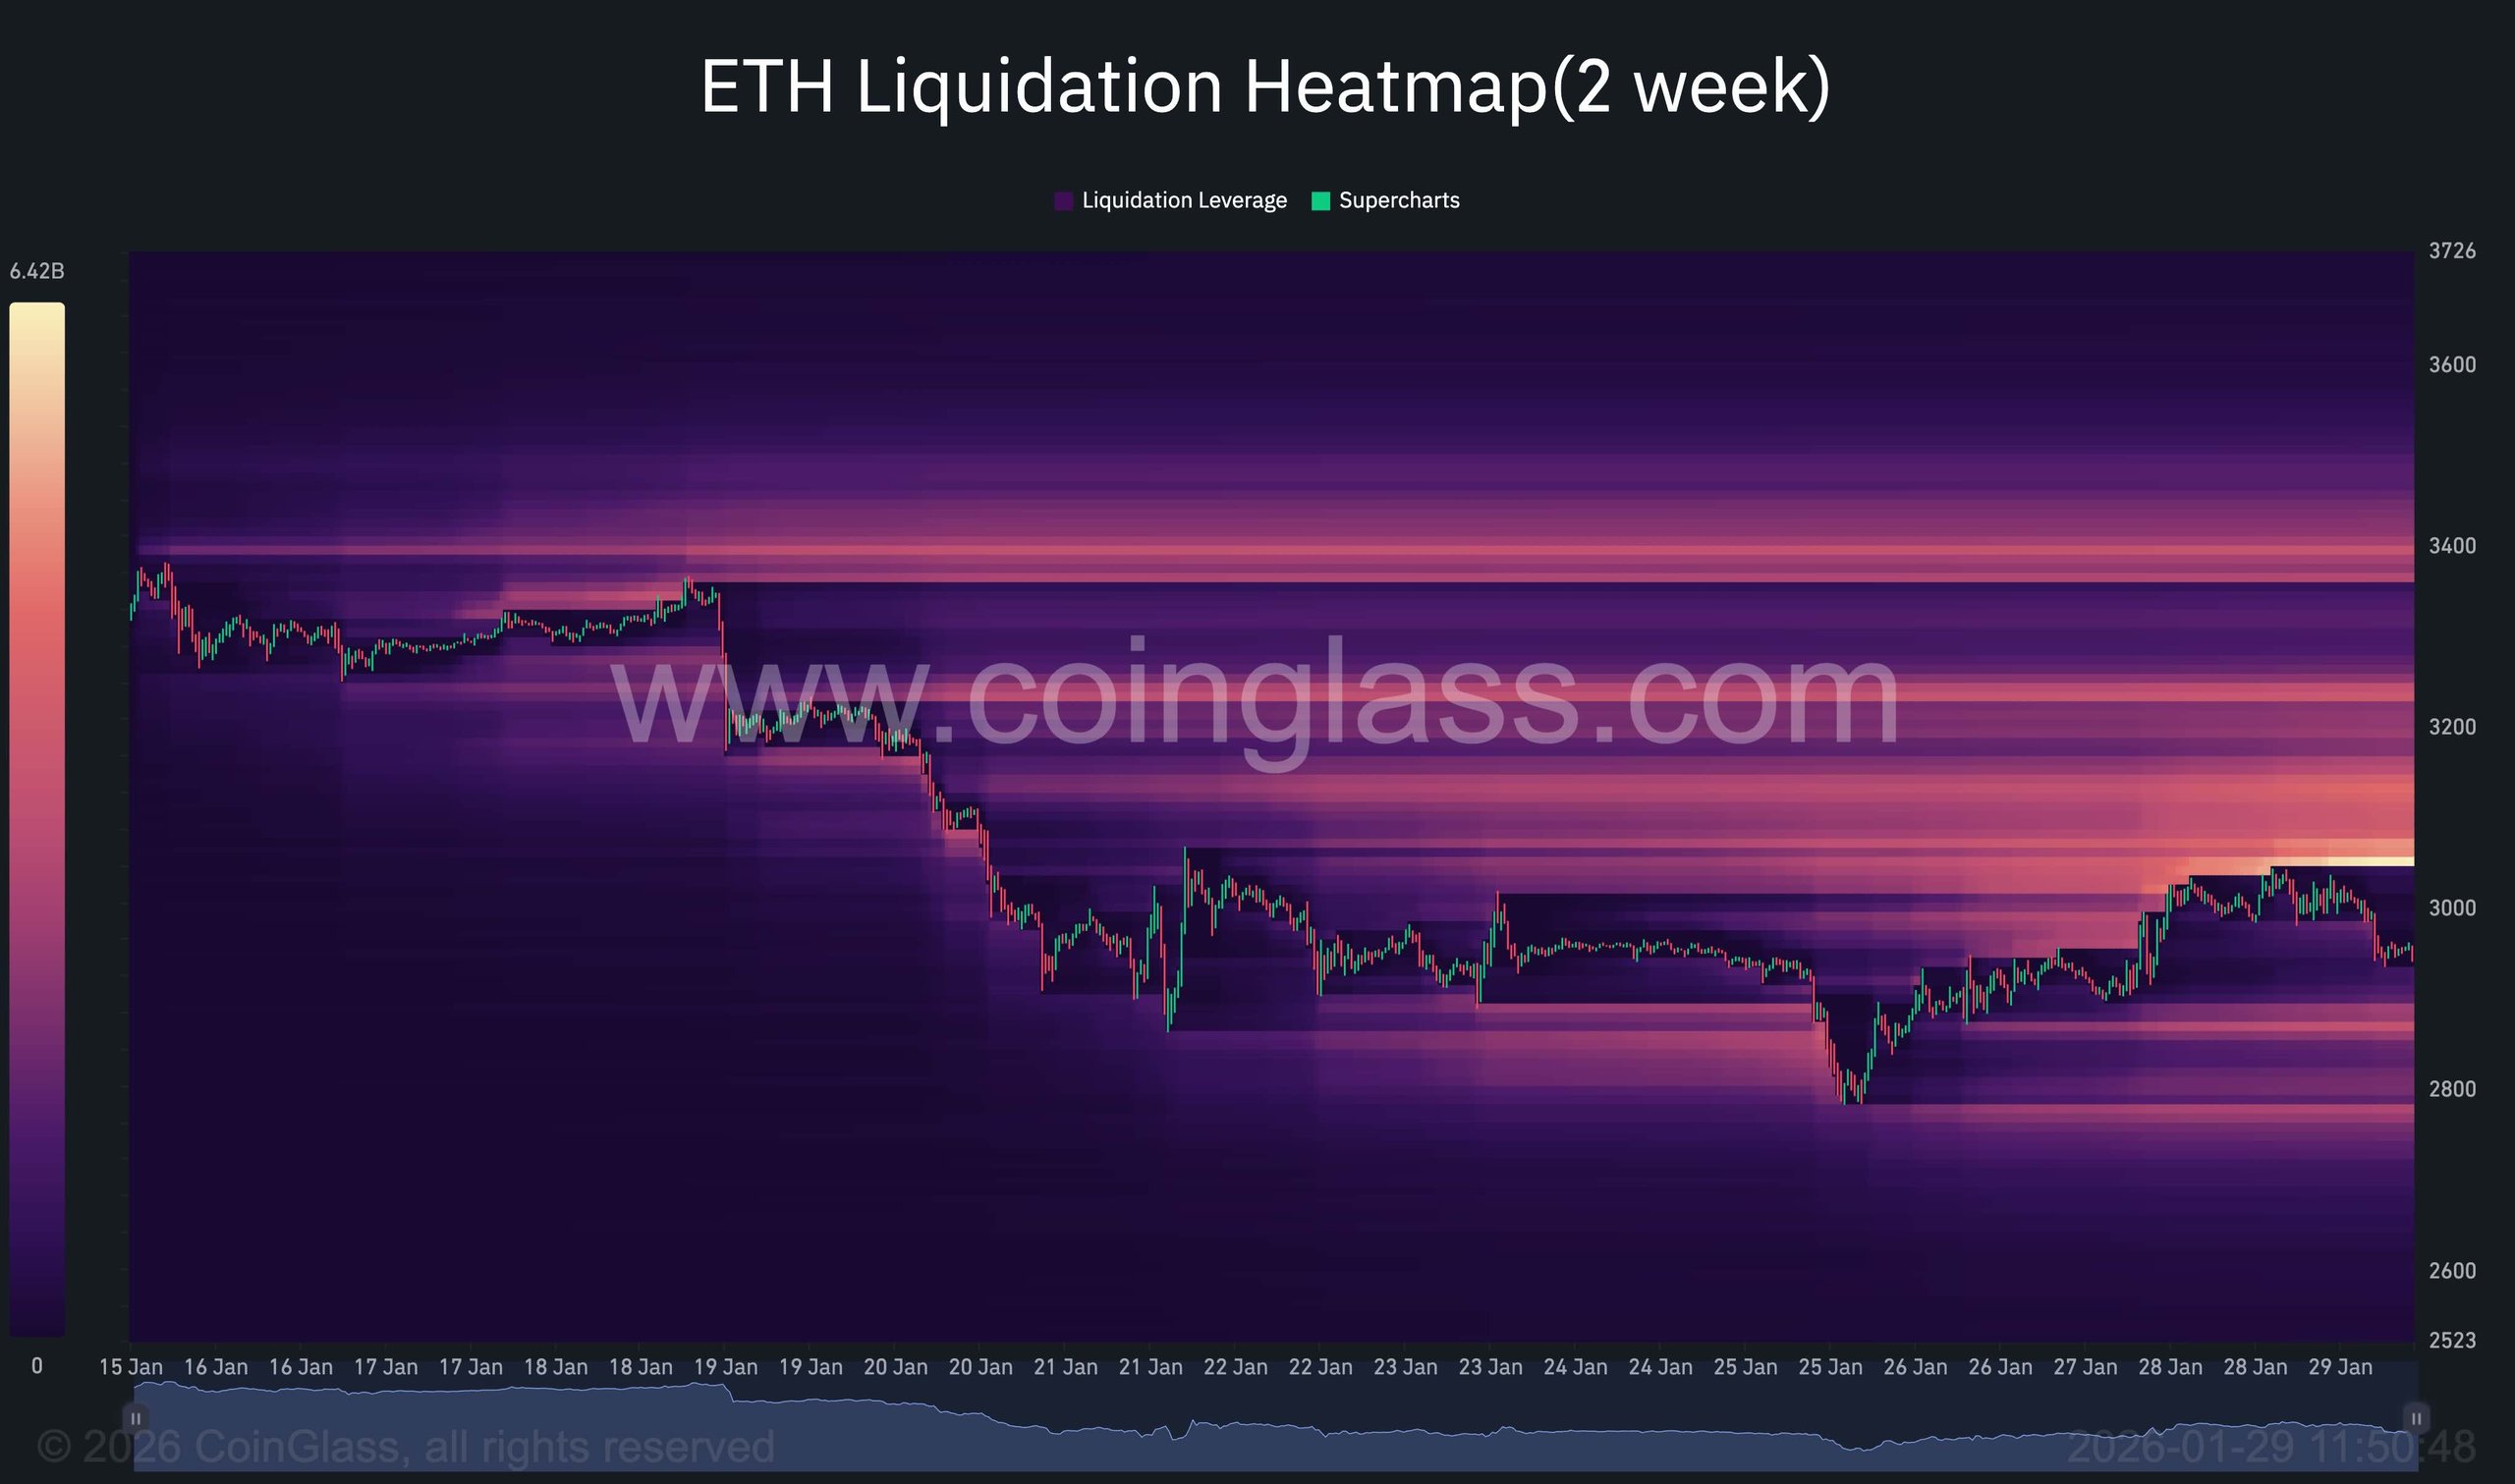 Ethereum Liquidation Heatmap
