Ethereum's Struggle: Is $1.8K the New Low or a Rebound Opportunity?
Ethereum faces significant bearish trends as it approaches a critical demand zone at $1.8K, leading to a potential consolidation phase amidst market uncertainty.


Ethereum is currently experiencing substantial downward pressure, with recent market activities reinforcing a prevailing downtrend. This reaction follows notable sell-side movements, emphasizing that the asset remains in a critical phase. Downside targets persist, though there may be opportunities for short-term relief.
Daily Chart Overview
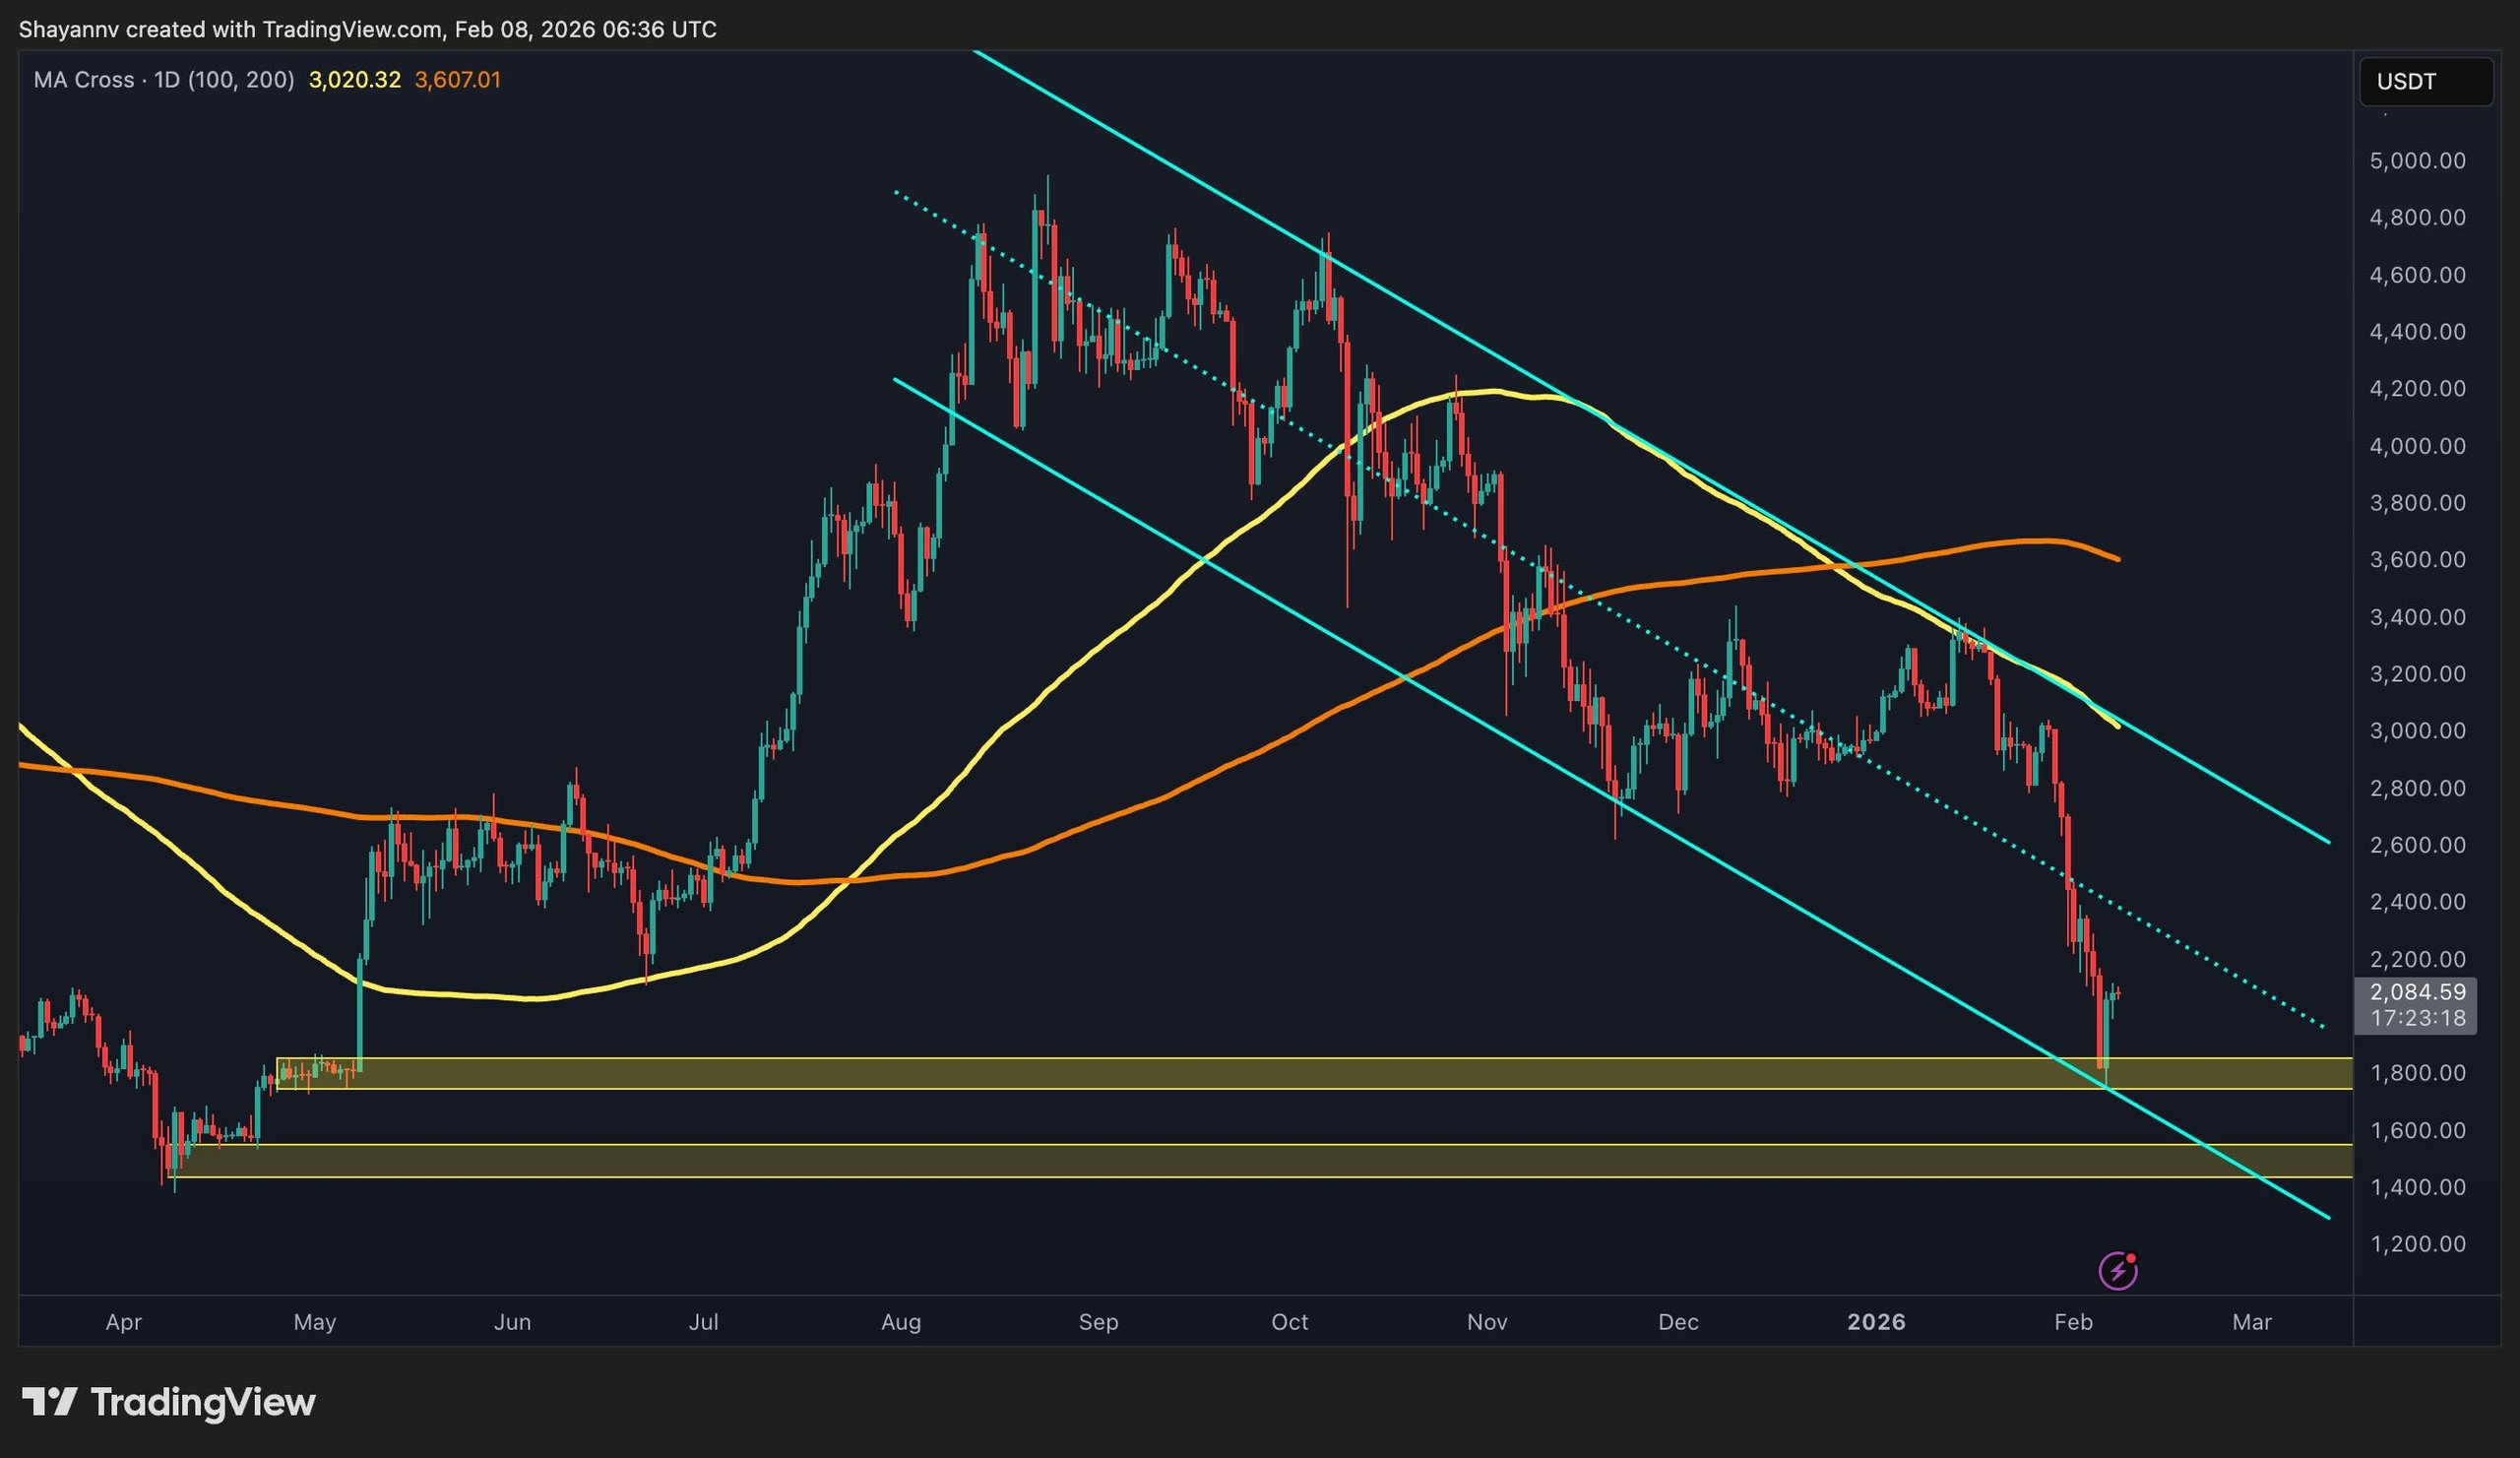
On the daily chart, ETH is seen within a descending channel, having recently reached the lower boundary of this pattern. A significant drop below former support levels has occurred, indicating strong bearish momentum instead of mere liquidity sweeps.
The recent decline has brought the price near a key demand area around $1.8K, a zone that served as a significant accumulation base previously. Although a slight bounce has taken place, it currently appears weak and lacks the strength to signal a solid reversal.
The market may now enter a consolidation phase above this support until a definitive breakout occurs. The middle line of the channel, set at $2.3K, poses as the main supply region during this interim phase. A breakthrough here would open pathways toward a more significant recovery at the $2.5K resistance level.
Daily ETH Chart
4-Hour Chart Analysis
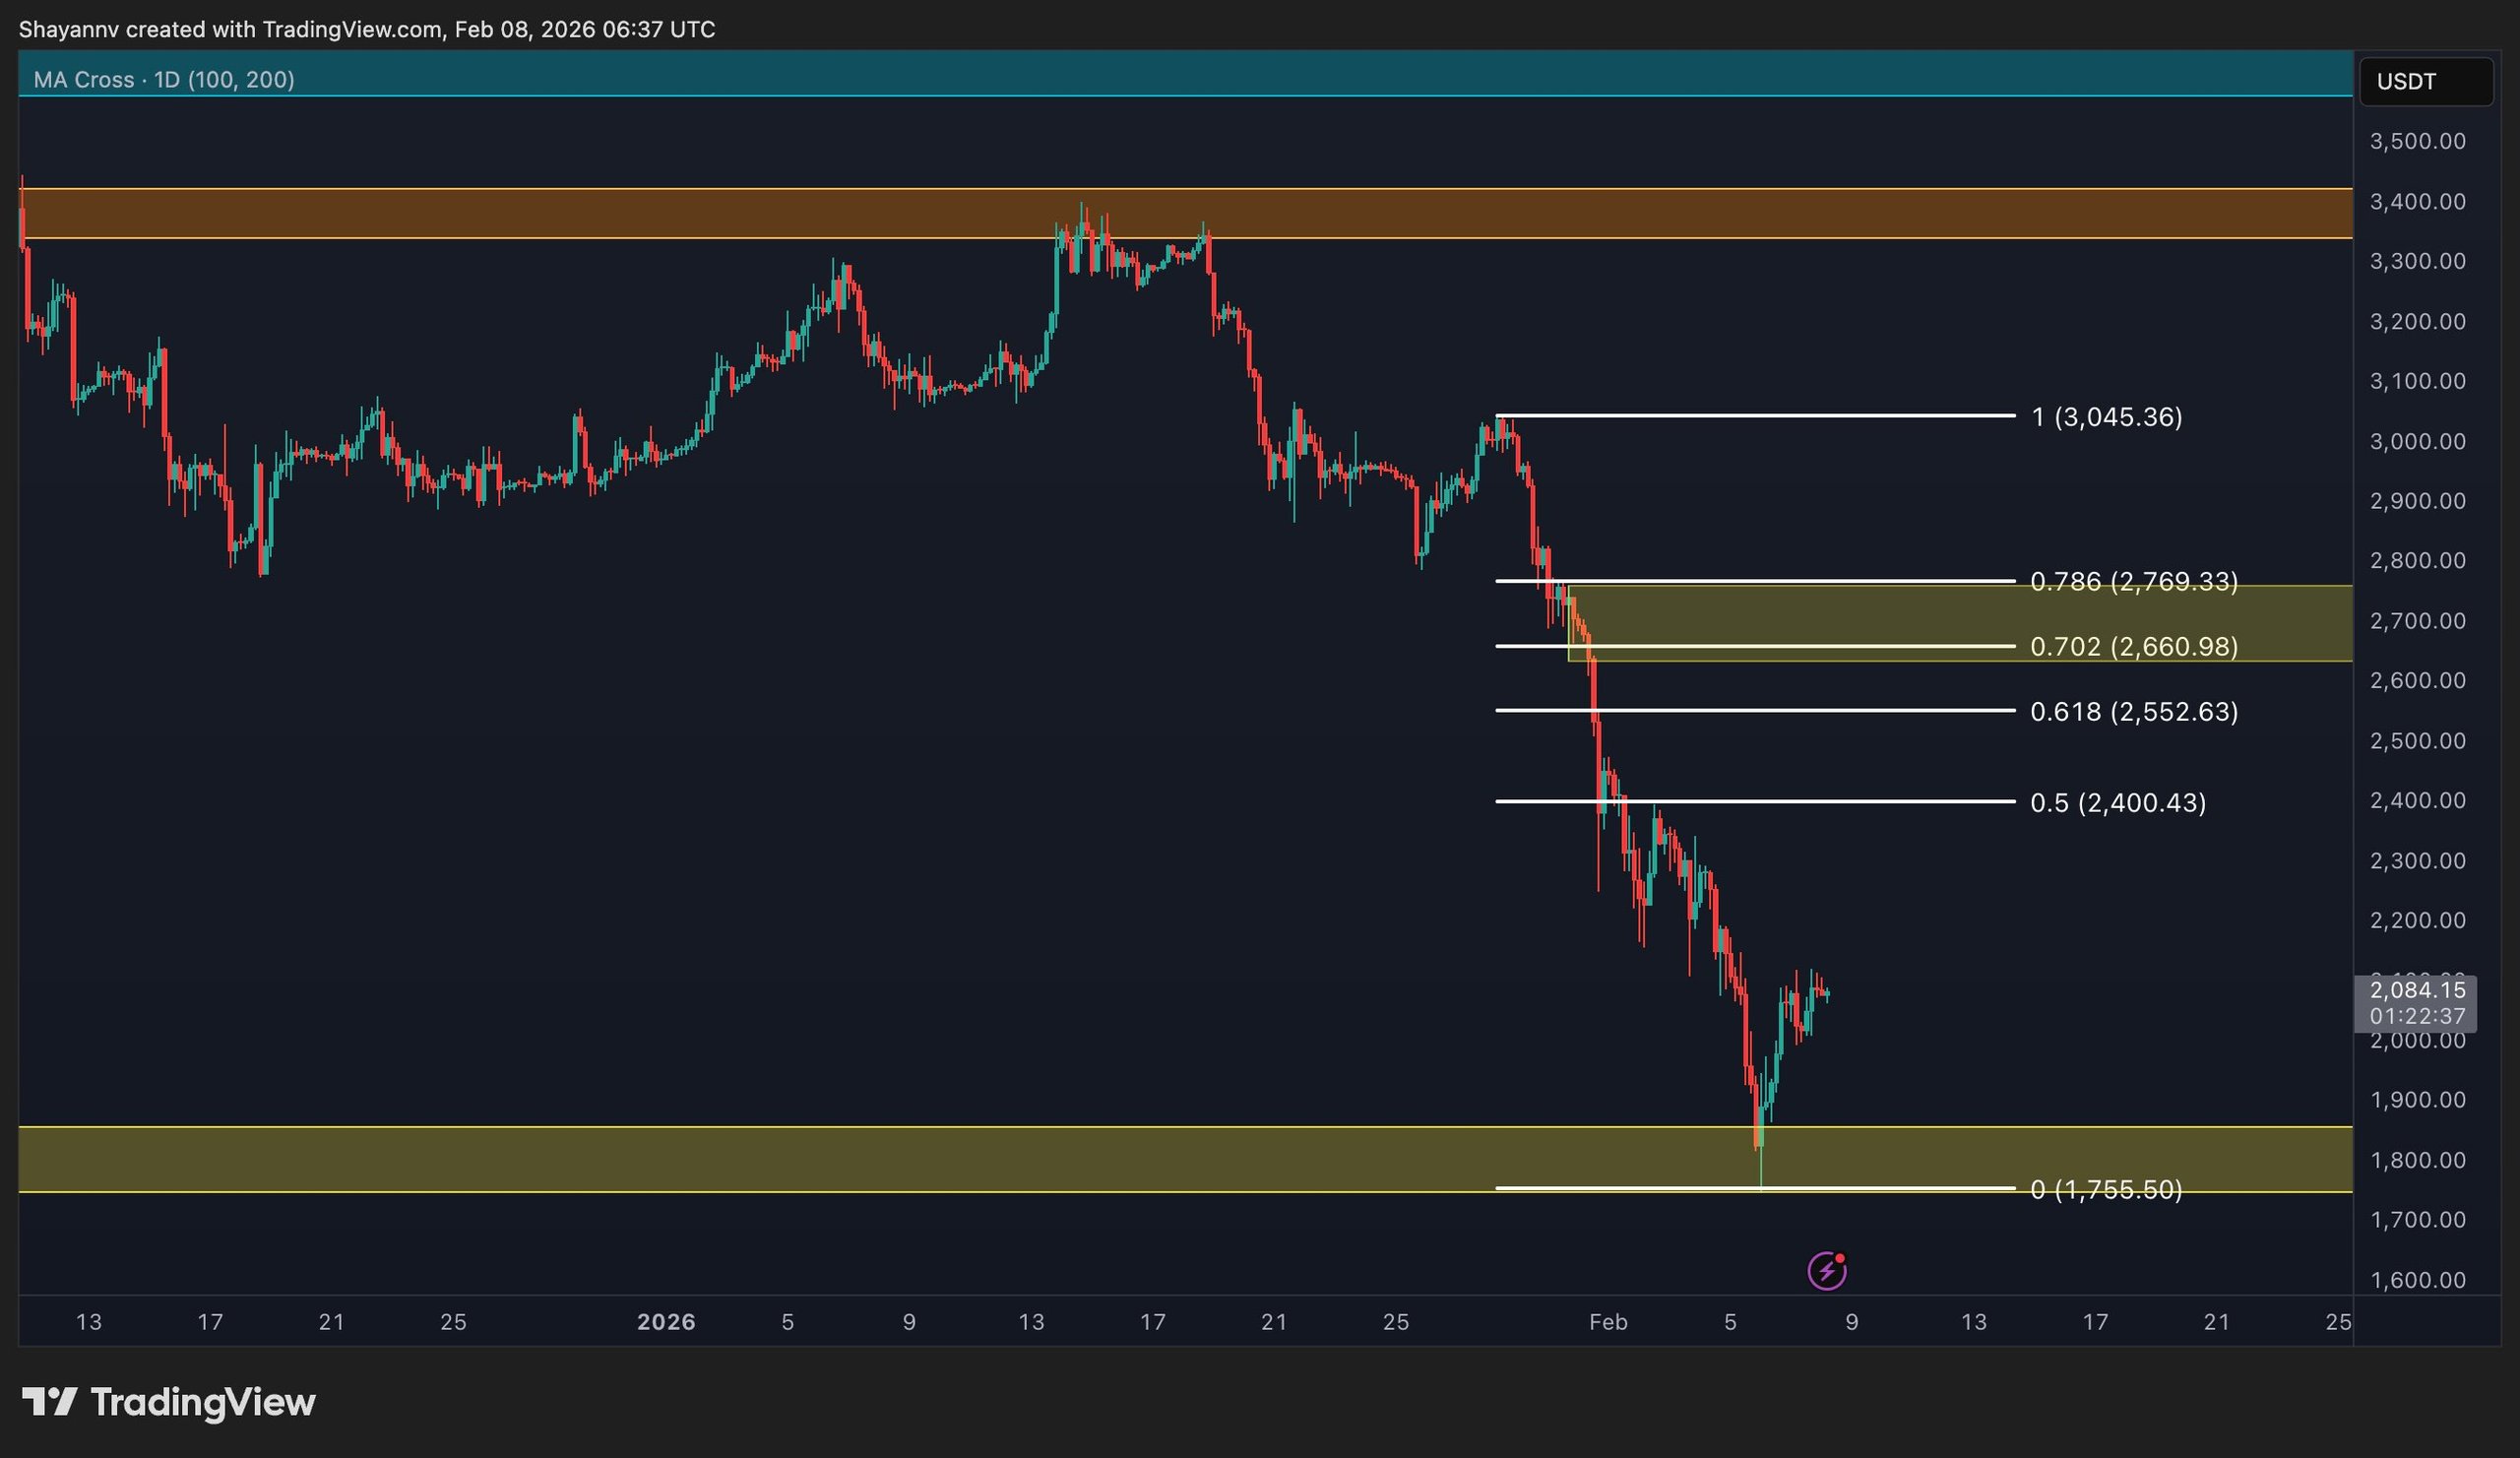
Examining the 4-hour chart reveals a clearer bearish structure. The latest price movements show a steep sell-off into demand followed by a weak rebound lacking strong momentum.
If price bounces return to recent supply zones between $2.3K and $2.6K, they might fail unless volume or momentum grows. Without reclaiming these supply points, a continuation to the downside trend seems favored, indicating a lack of reversal signals at this time.
 4-Hour ETH Chart
Sentiment Overview
Analyzing the ETH liquidation landscape of the past six months highlights critical patterns affirming a bearish trend. Notably, substantial liquidity has gathered just under the $2K mark, actively affecting price behavior.
The downturn near this level confirms the targeting of downside liquidity, flushing out many leveraged long positions. Although liquidity pockets linger slightly below current pricing levels, they indicate potential further downside movement before reaching a relative exhaustion point.
In conclusion, both technical and on-chain analyses strongly signal that Ethereum is operating under a bearish liquidity context, with risks persisting as the price struggles to surpass vital supply zones and secure ongoing demand.
