
Bitcoin's Bollinger Bands Signal Potential Price Movement Ahead
A significant tightening of Bitcoin's Bollinger Bands indicates an upcoming price shift, urged by both bullish and bearish indicators.


The Bollinger Bands indicator has reached its most compressed level in history, signaling a potential price shift for Bitcoin (BTC).
Record Bitcoin Bollinger Band Compression Indicates Volatility
According to Dorkchicken, a crypto analyst, Bitcoin’s Bollinger Bands are currently tighter than ever, a situation that has historically resulted in bullish market breakouts. The last significant downward trend following similar conditions occurred in 2022 when prices fell from $20,000 to $16,000.
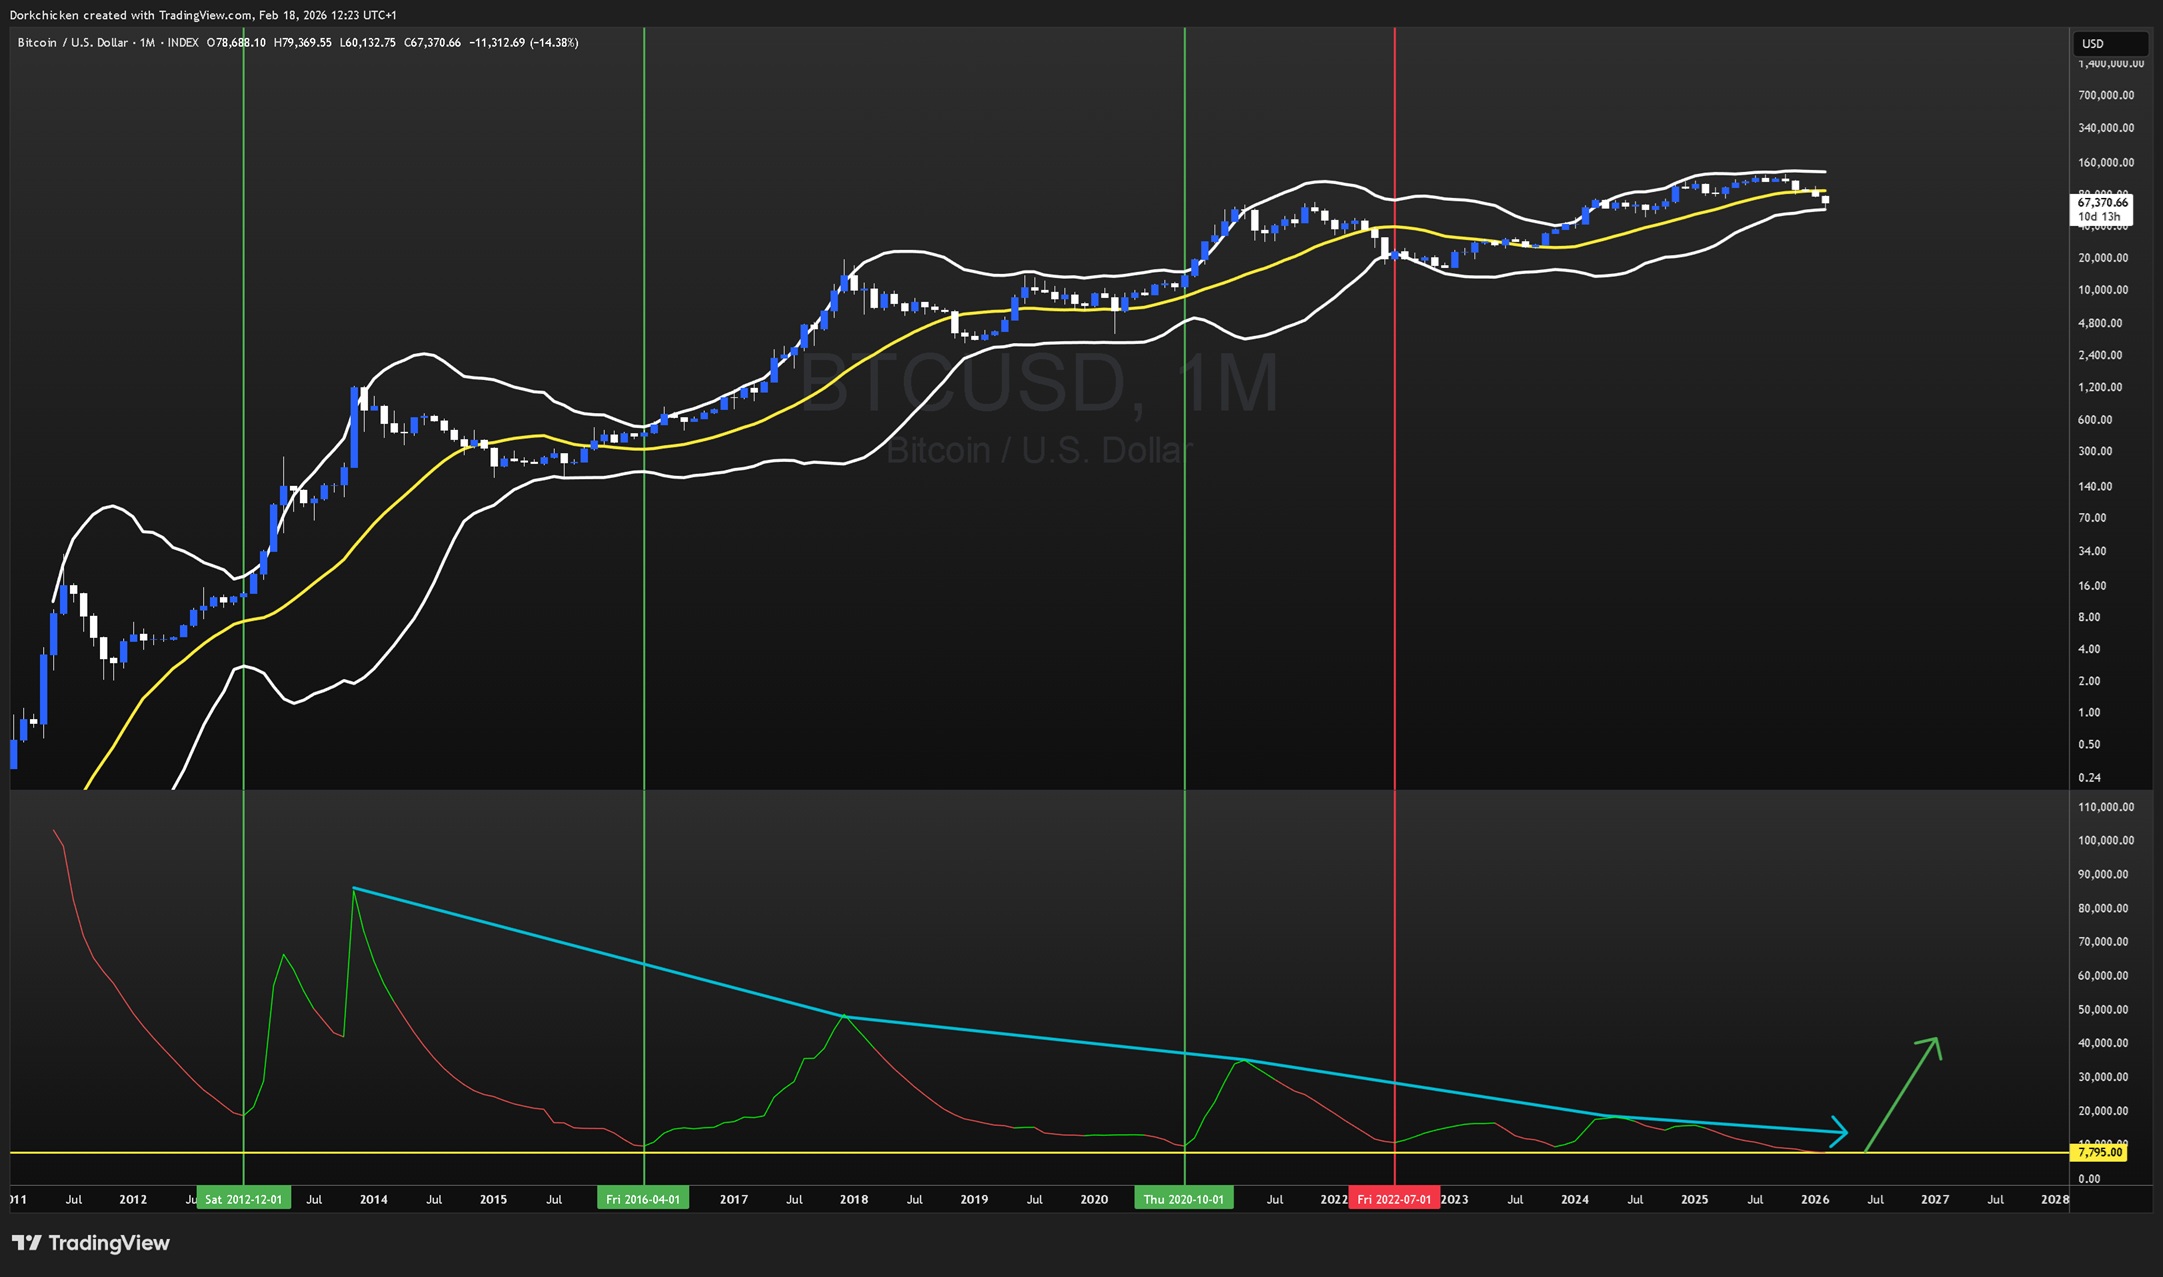 Bitcoin Bollinger Bands analysis. Source: Dorkchicken/X
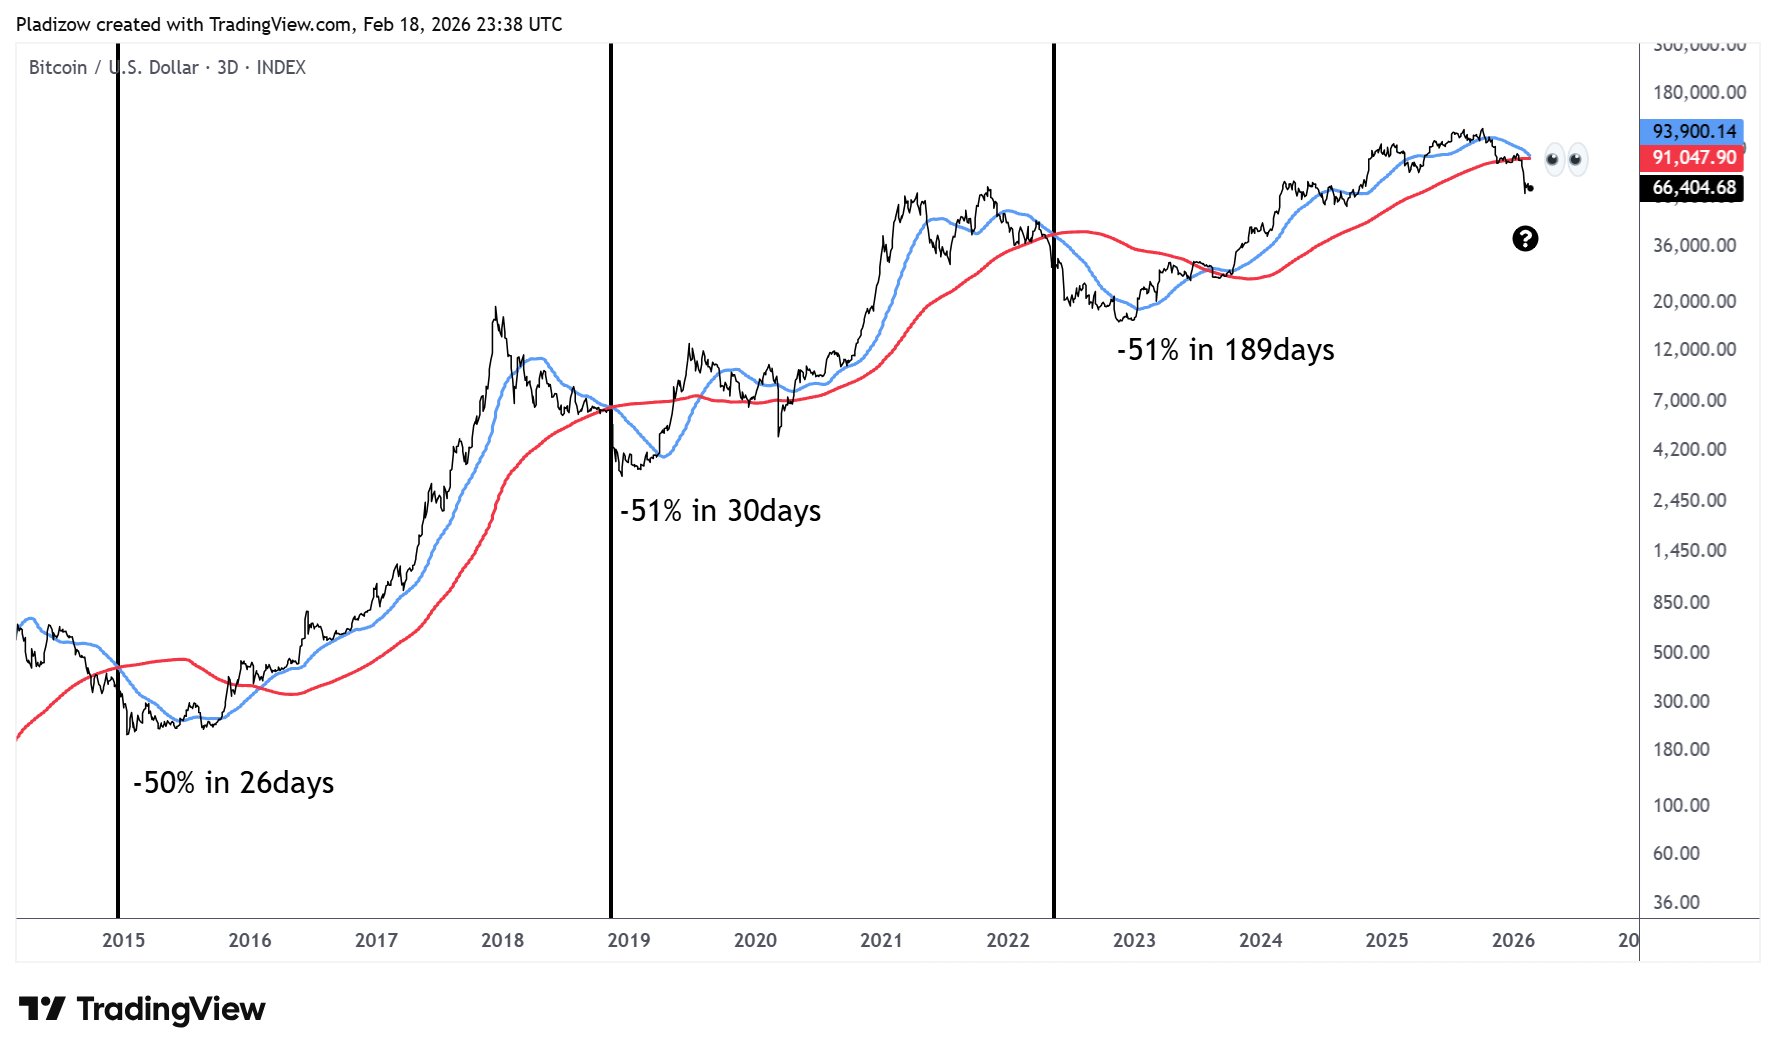
Bollinger Bands gauge market volatility; extreme compression often leads to rapid price movements. Nunya Bizniz, another trader, highlighted the potential for a ‘death cross’ in the 50- and 200-day moving averages, historically linked to market downturns.
 Bitcoin death cross on the three-day chart. Source: Nunya Bizniz/X
A death cross occurs when a shorter-term moving average falls below a longer-term one, indicating poor price momentum, which in prior cases led to drops around 50% over the following few months. The potential for Bitcoin to stabilize around $33,000 is noted, given its recent activity beneath wider-moving averages.
Ardi remarked that retail traders are increasingly long as market optimism grows, evidenced by 72% of accounts currently holding positions despite a downward trend.
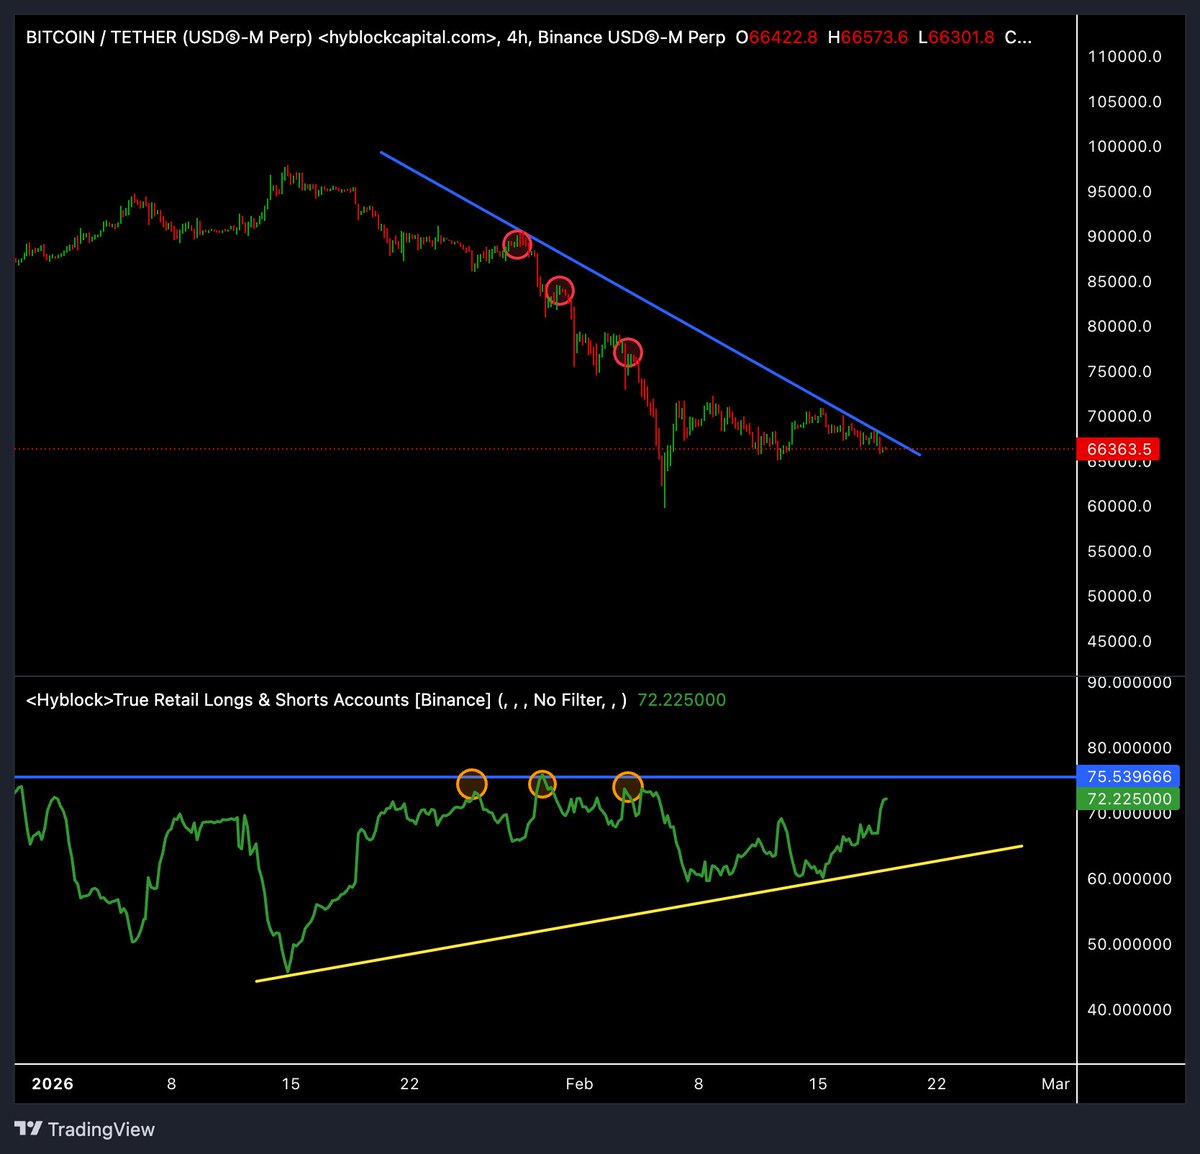 Bitcoin analysis by Ardi. Source: X
In a separate observation, MorenoDV indicated that Bitcoin’s short-term Sharpe ratio, which dropped to -38.38, signifies a major drawdown, aligning with historical lows that often precede price surges.
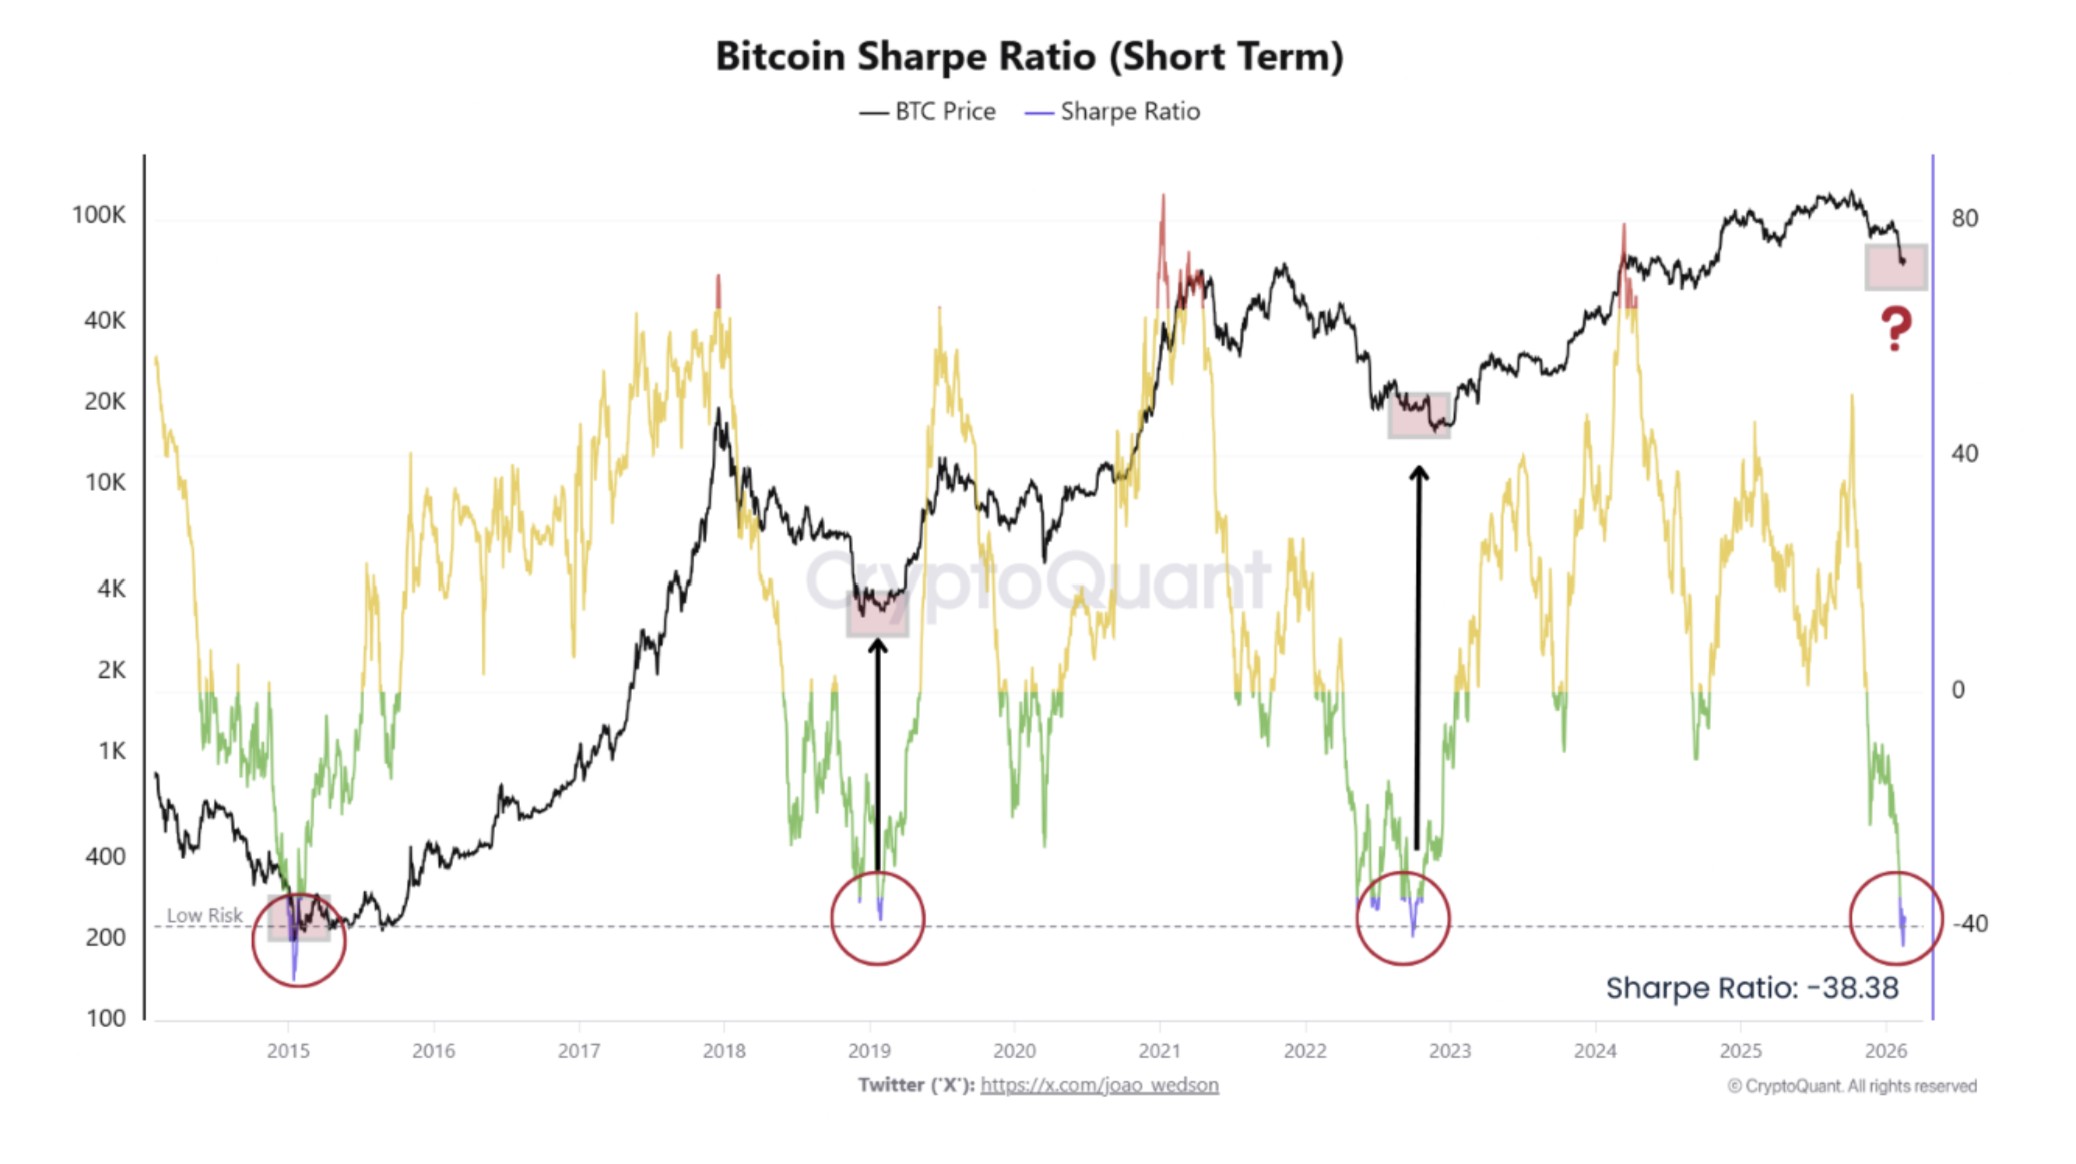 Bitcoin Sharpe Ratio. Source: CryptoQuant
Overall, the recent patterns in BTC’s trading behavior could present an opportunity for investors if historical trends hold true.
