


Bitcoin’s recent trading patterns show a renewed sense of weakness, particularly after failing to maintain momentum beyond the $70,000 mark. This resistance at a critical psychological level has reignited a cautious outlook among traders, as sellers have regained dominance, pushing prices below previous daily lows.
Bitcoin Price Review: The Daily Trends
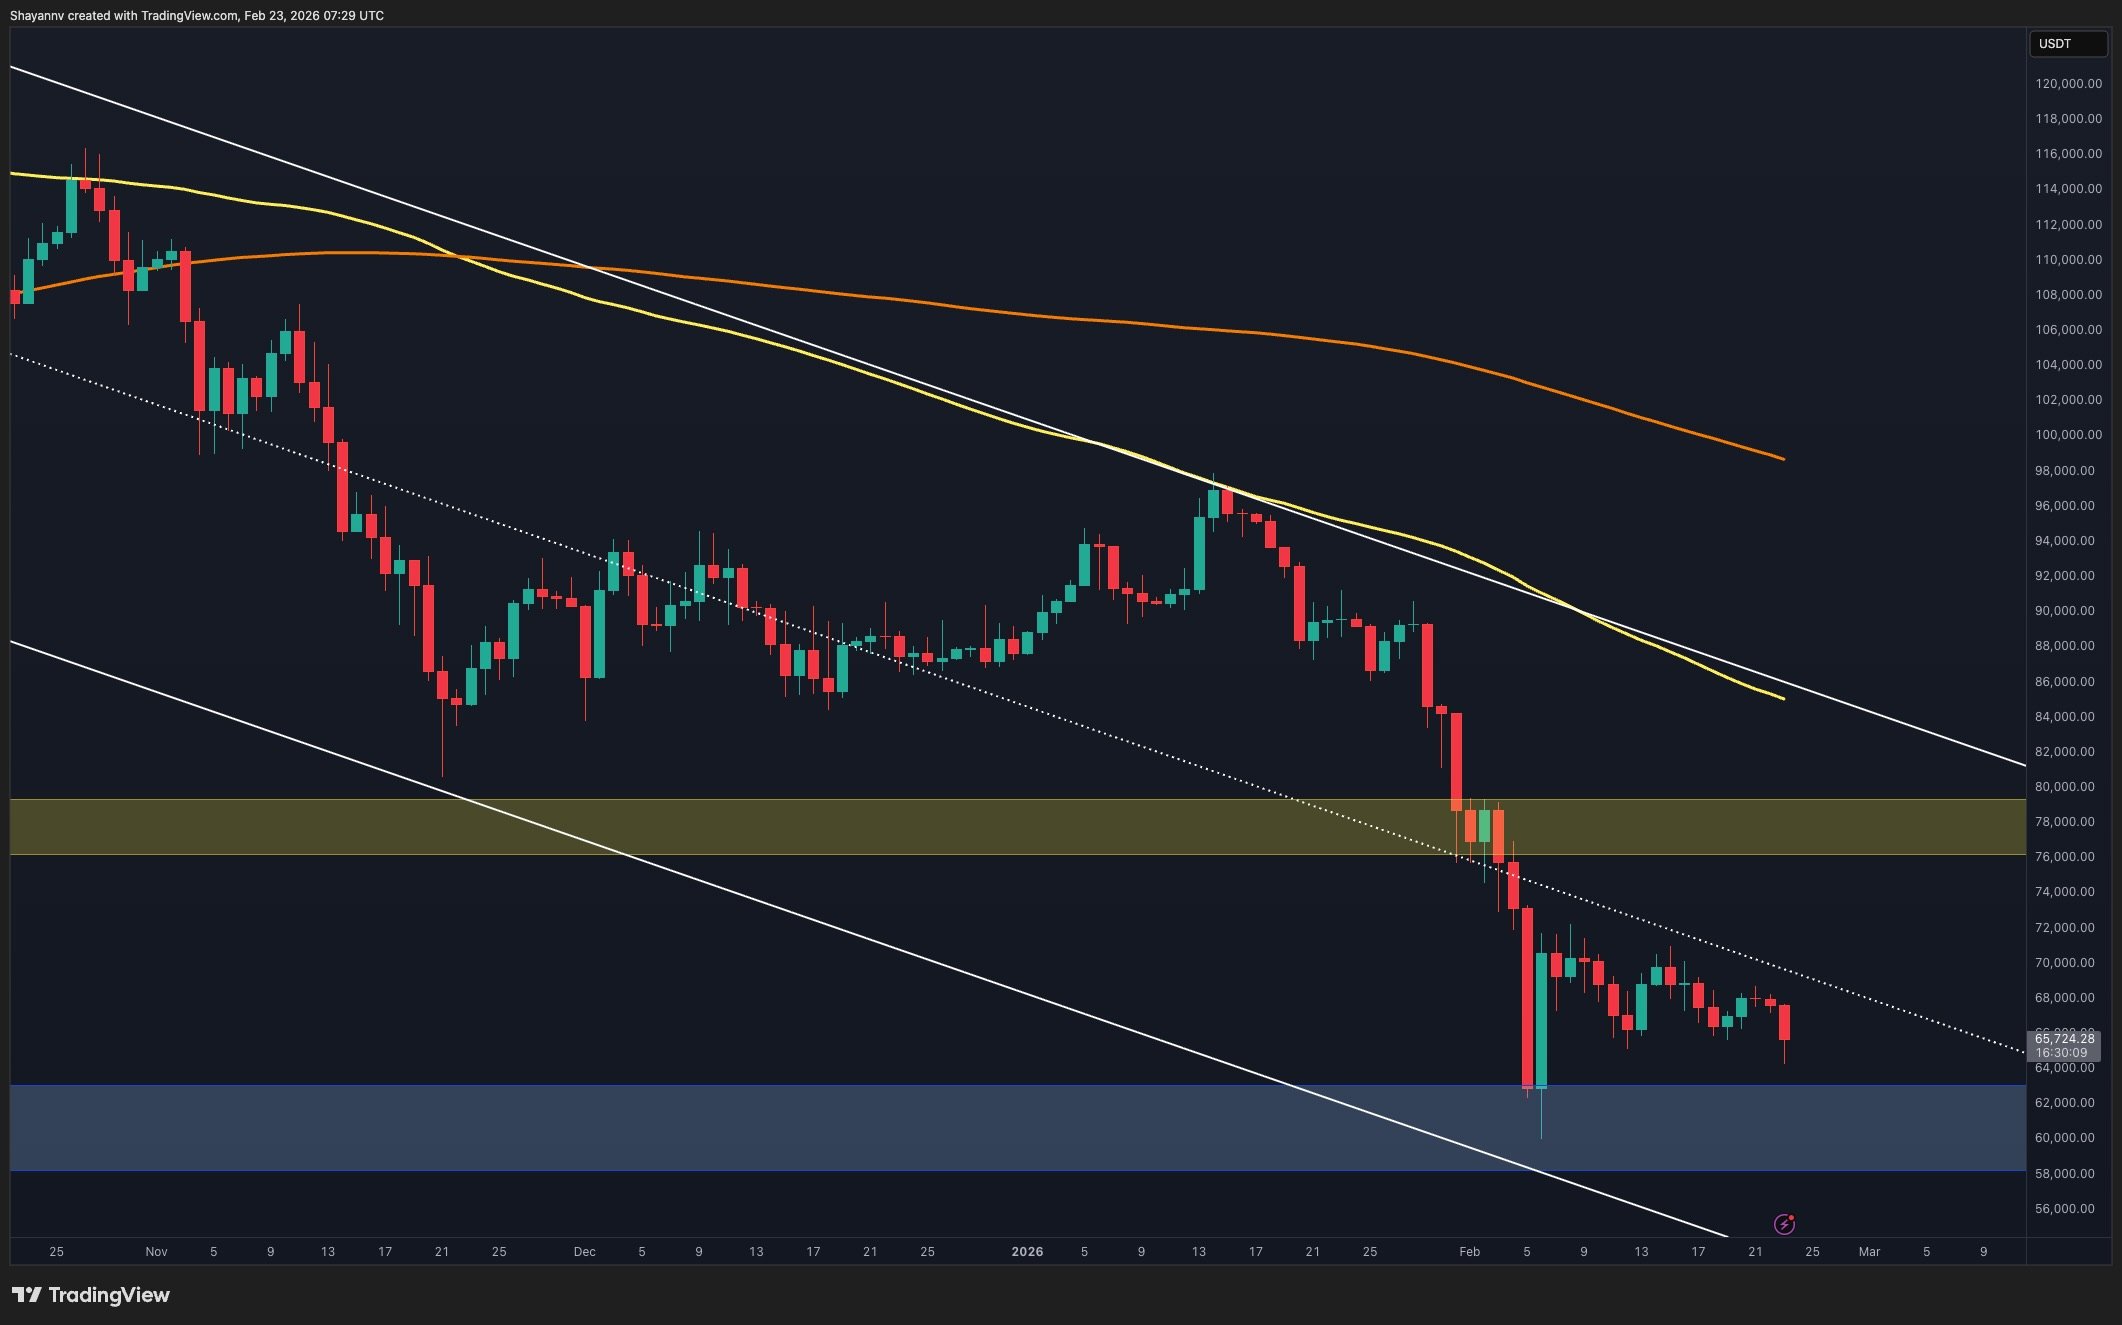
On the daily chart, Bitcoin recently experienced rejection at the $70,000 level, where increased selling pressure drove the price down. This occurrence underscores the presence of sellers at higher price levels and highlights the tenuous nature of any recovery attempts. Currently, Bitcoin seems poised for continued circulation between the support level of $60,000 and the resistance level of $75,000. A breakout above either level will be crucial for the next significant trend movement, while continued rejection near $70,000 indicates a cautious short-term sentiment.
Daily BTC Chart
BTC/USDT 4-Hour Review
On the shorter 4-hour chart, Bitcoin was previously consolidating within a symmetrical triangle following a rapid recovery from the $60,000 low. However, that pattern has now shifted downwards, breaking below the ascending support trendline and gaining downward momentum.
This breakdown affirms a continuation of bearish sentiment in the short term, directing attention toward the lower boundary of demand zones. Should the price rebound towards the vicinity of the broken triangle support or the $74,000–$76,000 high supply threshold, it may likely be viewed as a corrective retest unless buyers produce substantial momentum.
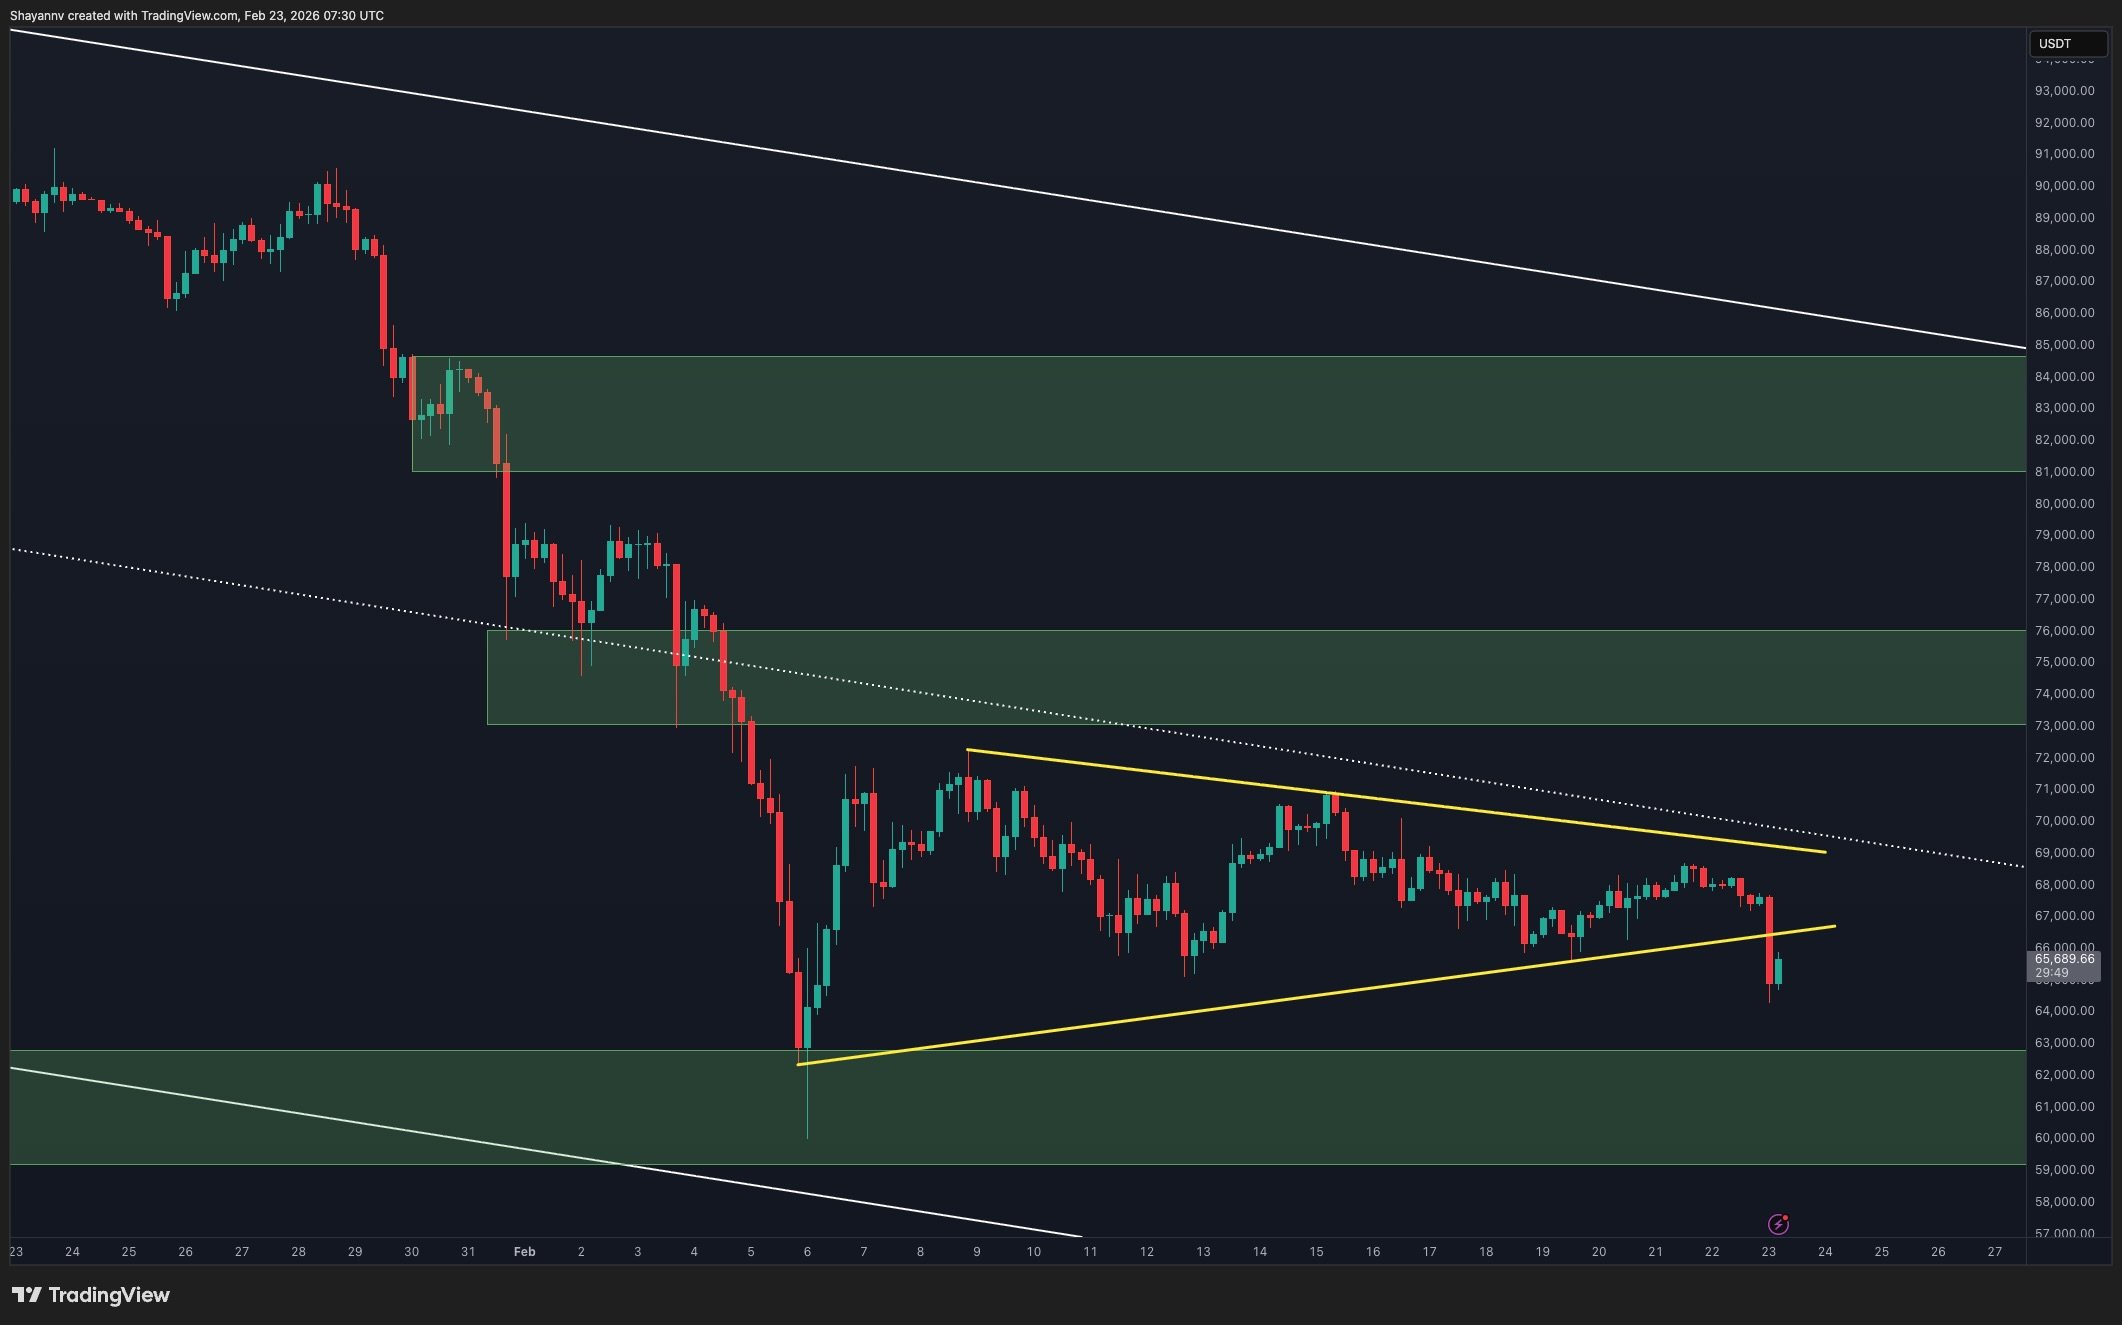 4-hour BTC Chart
Market Sentiment Insights
Analyzing the liquidation landscape reveals a dense liquidity area above near the $69,000–$70,000 range, which served as a pivotal support during the previous consolidation phase. This region absorbed price declines several times before the recent downturn, demonstrating its role as a formidable resistance zone.
Conversely, moderate liquidity bands have surfaced below the market within the $62,000–$65,000 segment. The abrupt descent has engaged this liquidity pocket, triggering liquidations and increasing volatility. The ongoing presence of liquidity beneath suggests the potential for further downward movement, particularly if market momentum continues to weaken.
Overall, Bitcoin’s positioning between rising overhead resistance and lower liquidity levels casts uncertainty over its next moves, as the interplay between these factors will dictate whether it maintains stability above $60,000 or enters a deeper corrective phase.
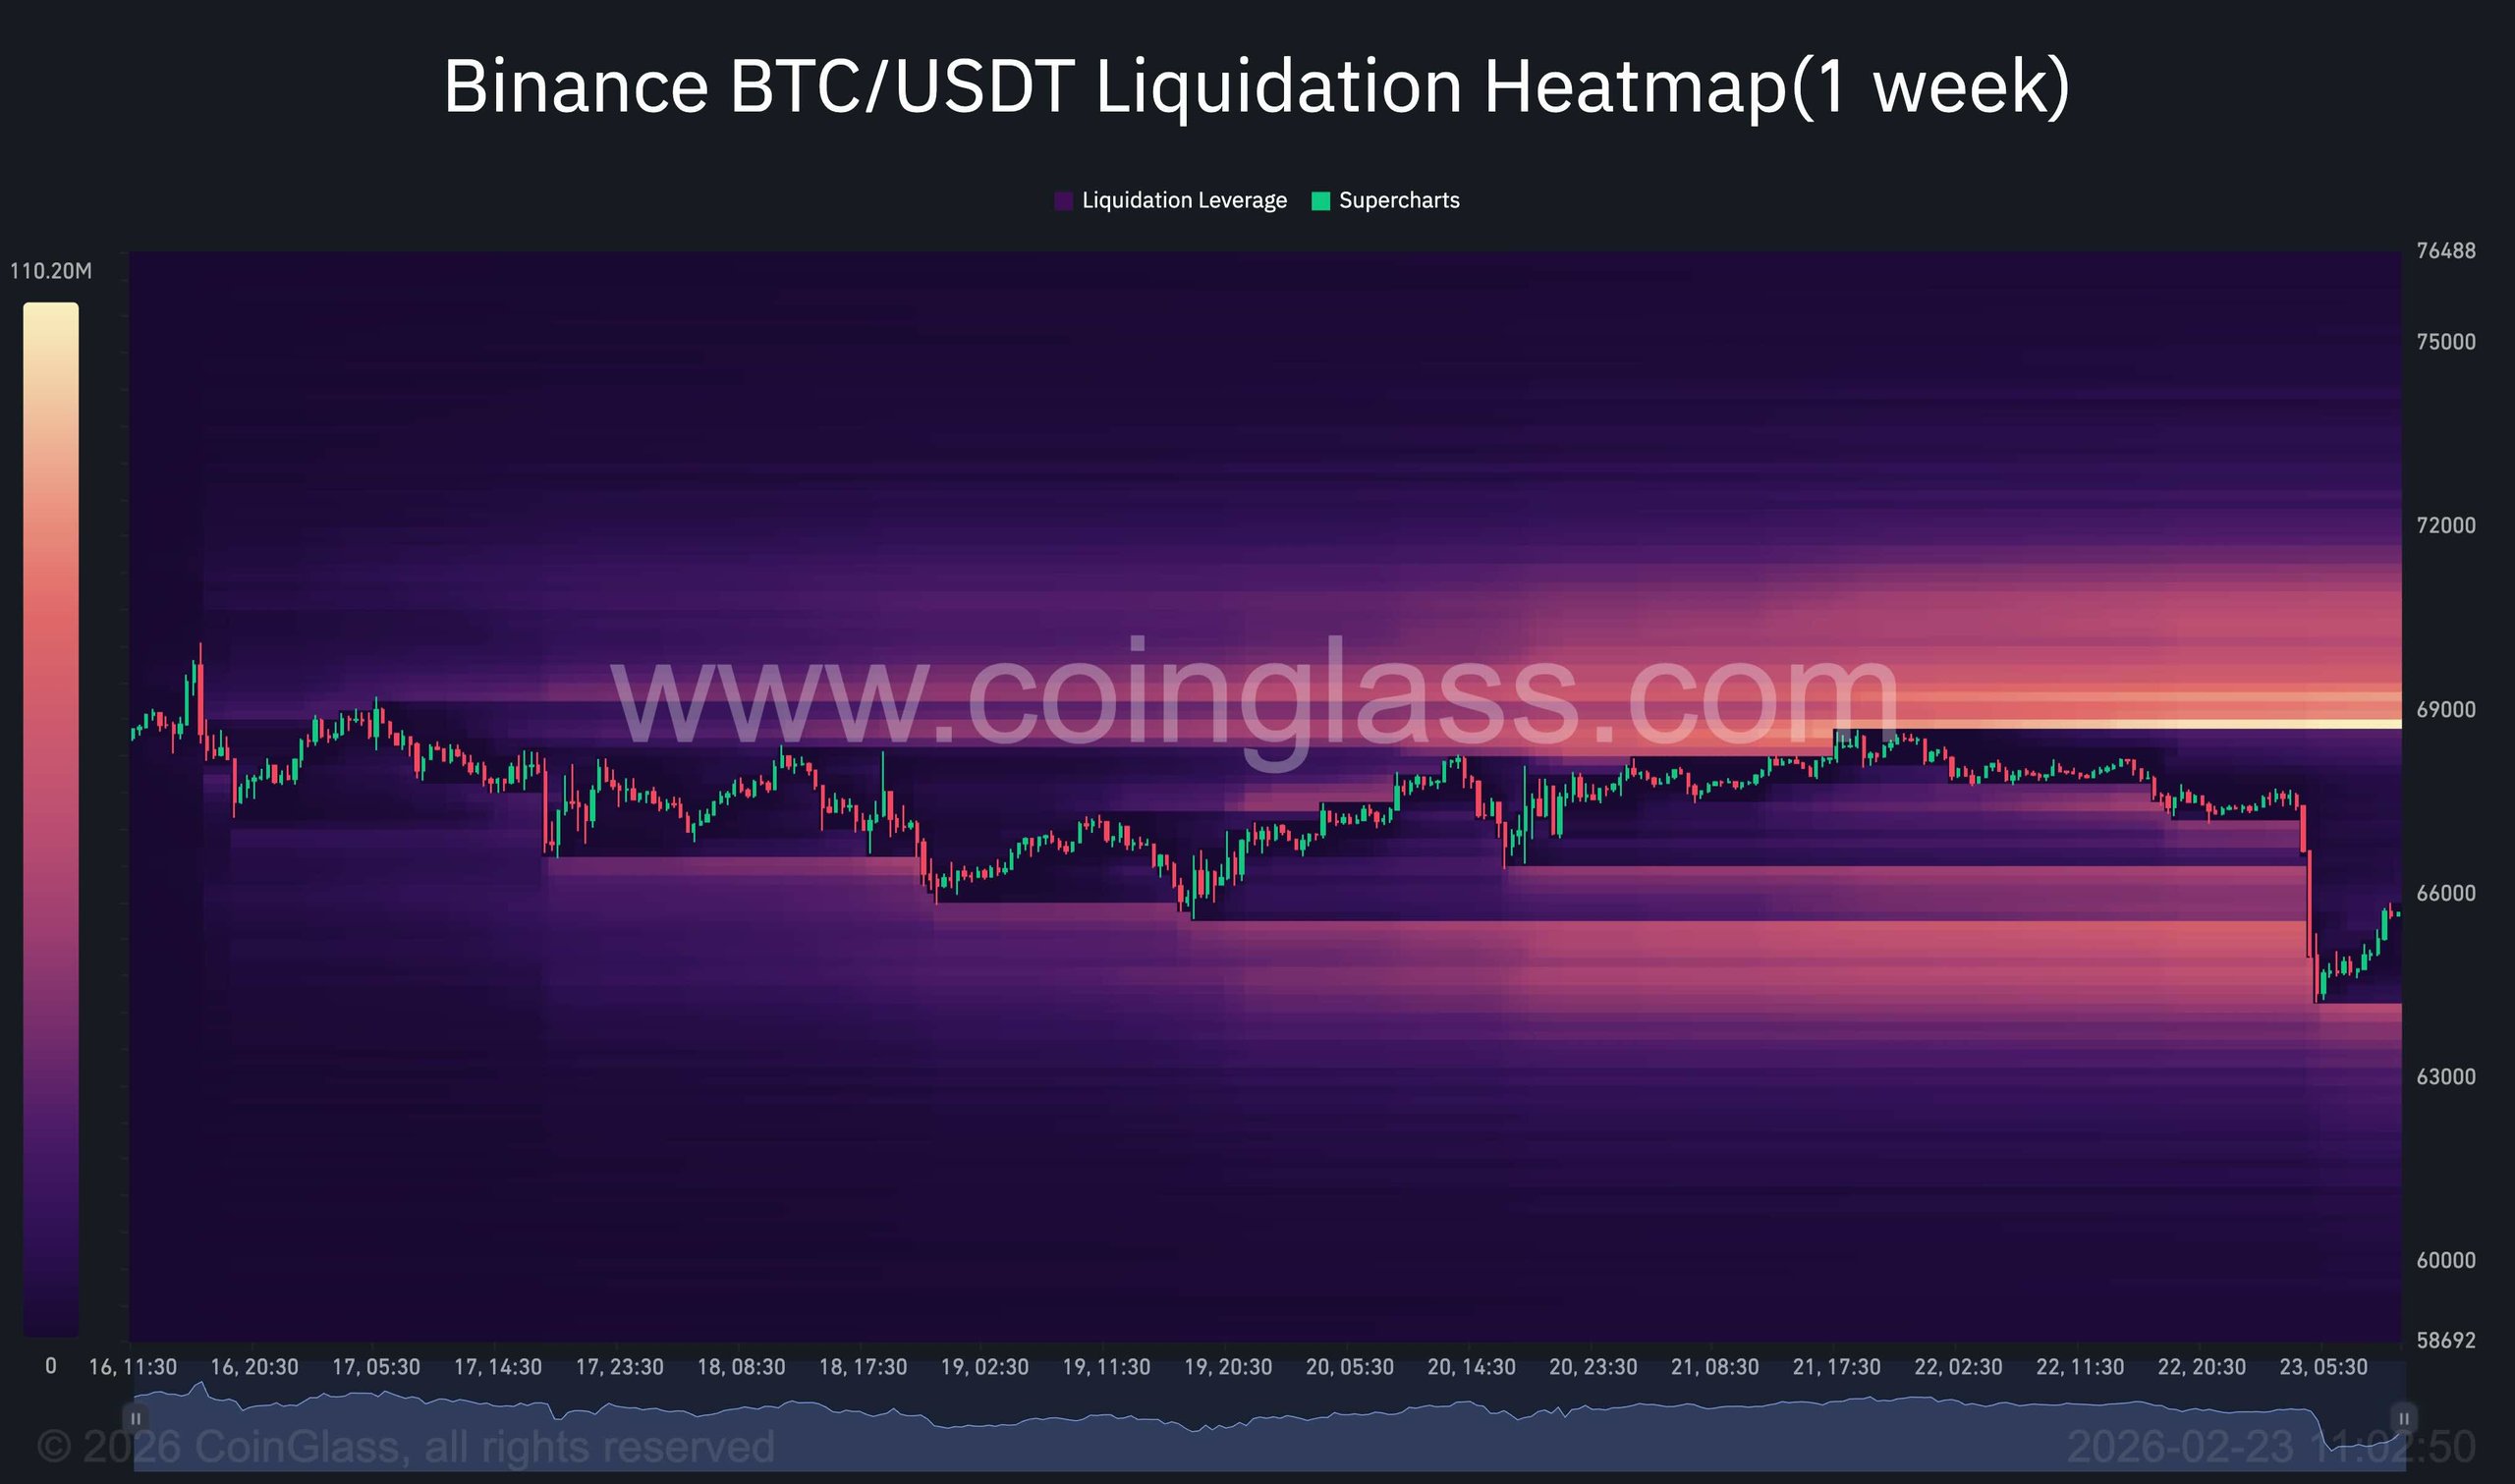 Liquidity Heatmap
Special Offers
- Receive up to $600 at Binance when you register with exclusive links.
- Special limited offer for CryptoPotato readers to get a $500 FREE position on Bybit.
