Ethereum Price Outlook: What Happens If the $2K Support Fails?
Ethereum struggles to maintain its position above the critical $2K support level as bearish trends loom.


Ethereum is once again facing hurdles in its recovery trajectory. The price is declining after an unsuccessful attempt to hold its ground around the significant $2,400 resistance level. The market overall is struggling to stabilize following a sharp downturn, compounded by ongoing concerns regarding geopolitical tensions in the Middle East, which impede buyers’ momentum.
Ethereum Price Analysis: Daily Perspective
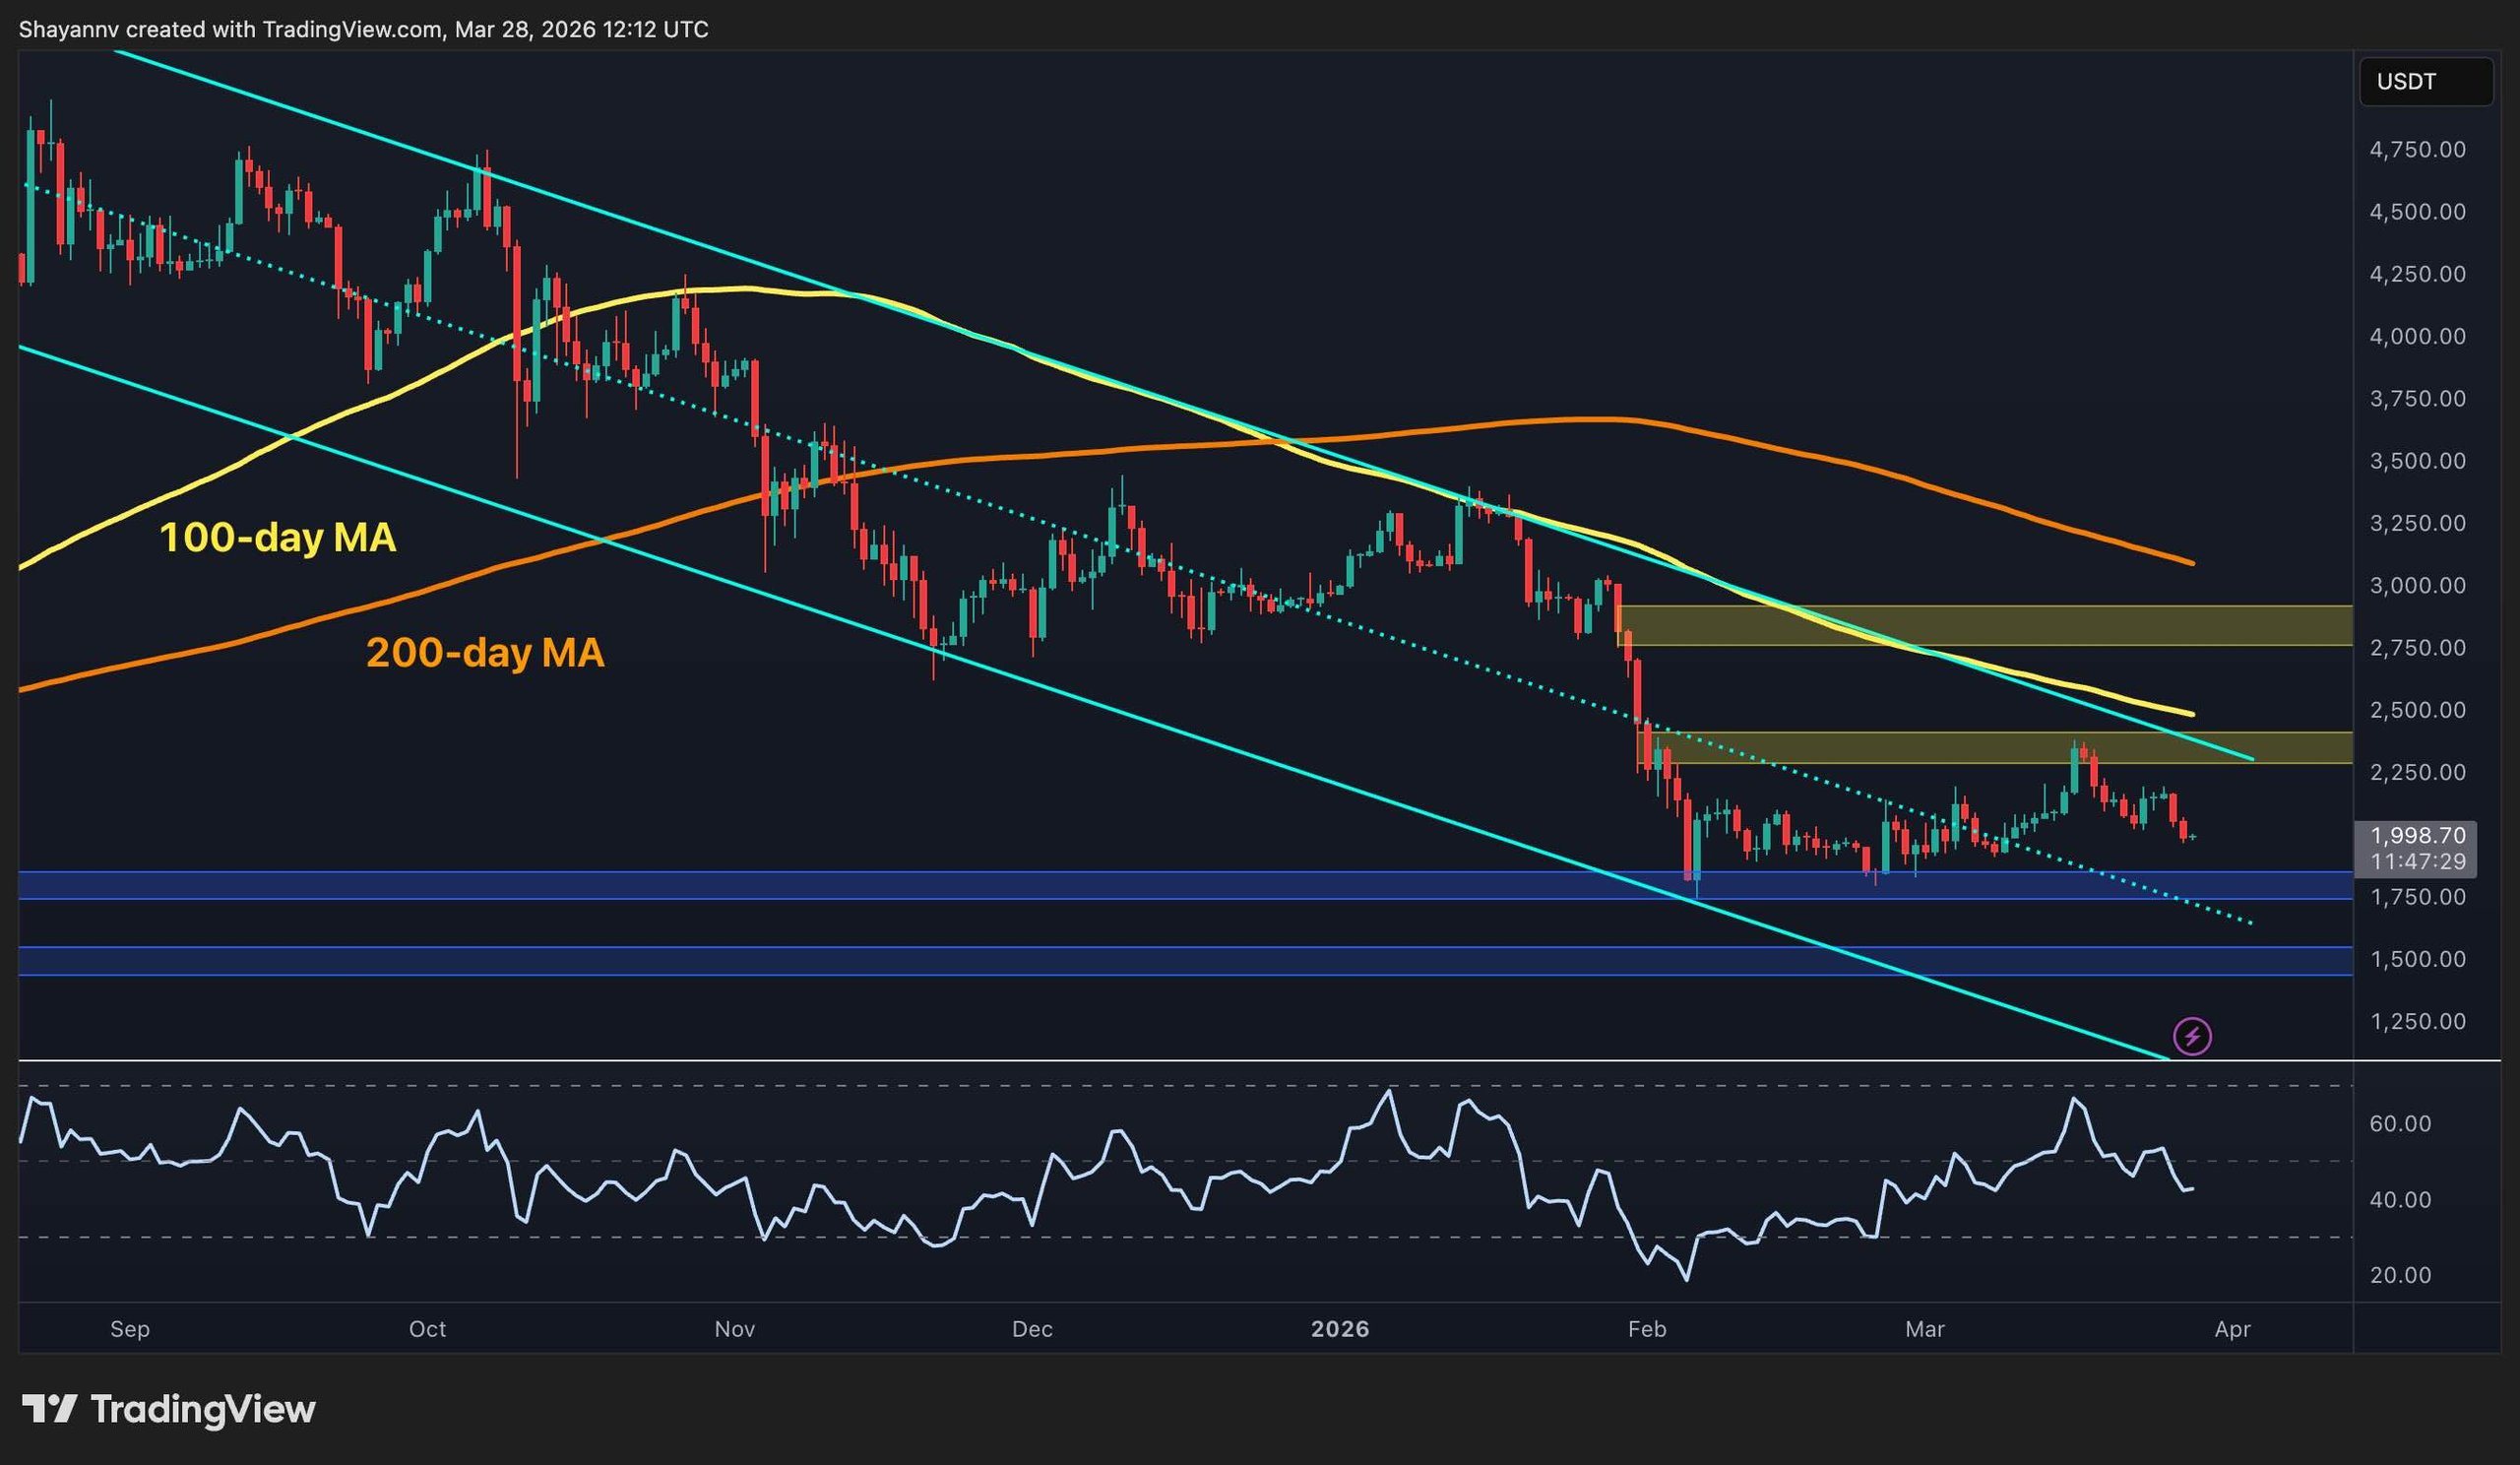
On the daily chart, ETH is notably tracking below both the 100-day and 200-day moving averages, which are positioned at approximately $2,500 and $3,100, respectively. These averages are trending downwards, presenting dynamic resistance. The prevailing pattern indicates lower highs, with recent rebounds failing to achieve an escape from the descending channel pattern.
The asset recently attempted to rise into the $2,400 area but could not maintain this position, further establishing this zone as a pivotal resistance cluster. This region corresponds with a bearish order block and continues to exert selling pressure. As long as ETH remains below this threshold, the broader trend is expected to remain bearish, with the $1,800 support level appearing to be the next likely target in the coming days.
Ethereum Daily Chart
ETH/USDT 4-Hour Chart
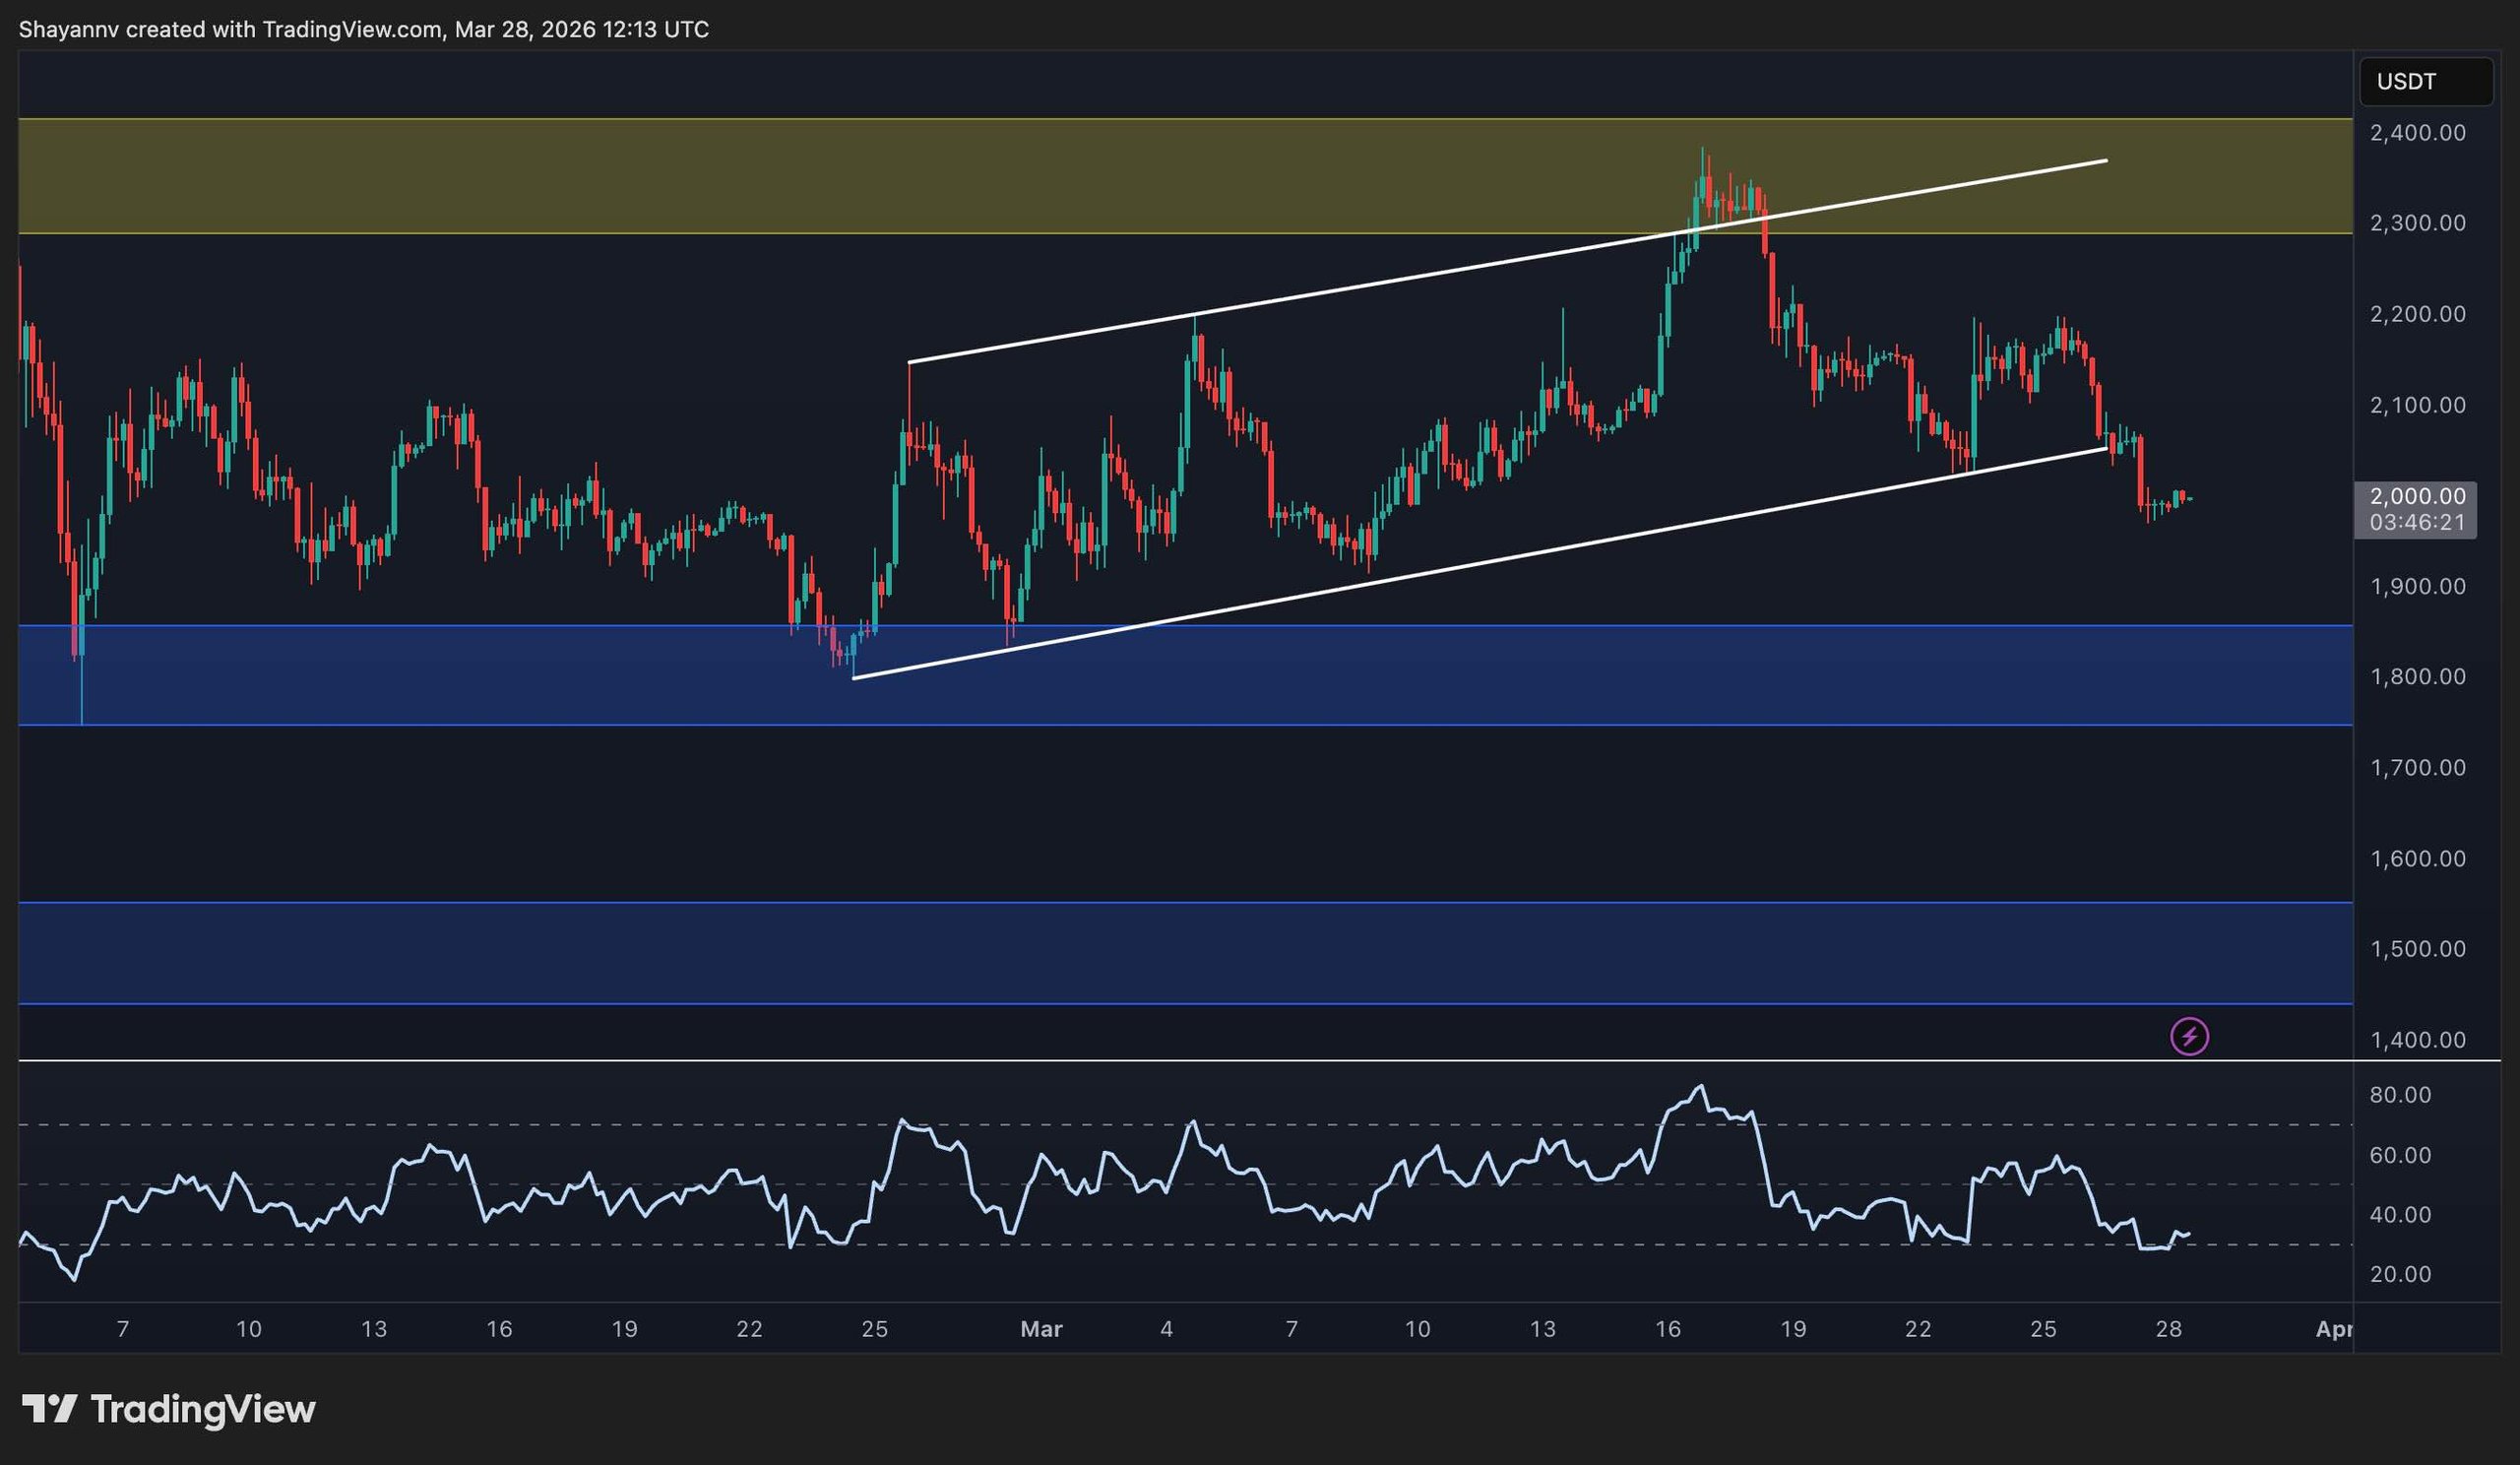
On the 4-hour chart, the short-term recovery narrative has noticeably deteriorated. ETH was earlier trading within an ascending channel, a structure which has since succumbed to a breakout below the channel’s support line.
A failed breakout and subsequent rejection at the upper boundary near $2,400 initiated this pronounced pullback, resulting in the asset now hovering around the $2,000 mark, which acts as a short-term pivot. Momentum has significantly cooled, reflected by the RSI’s dip back towards neutral levels.
Should ETH lose the $2,000 mark decisively, the implications could worsen, with a likely retest of the $1,800 demand zone. Conversely, in order to regain momentum, buyers must elevate the price beyond the previous peak of $2,200 to adjust the market structure favorably.
 Ethereum 4-Hour Chart
Sentiment Analysis
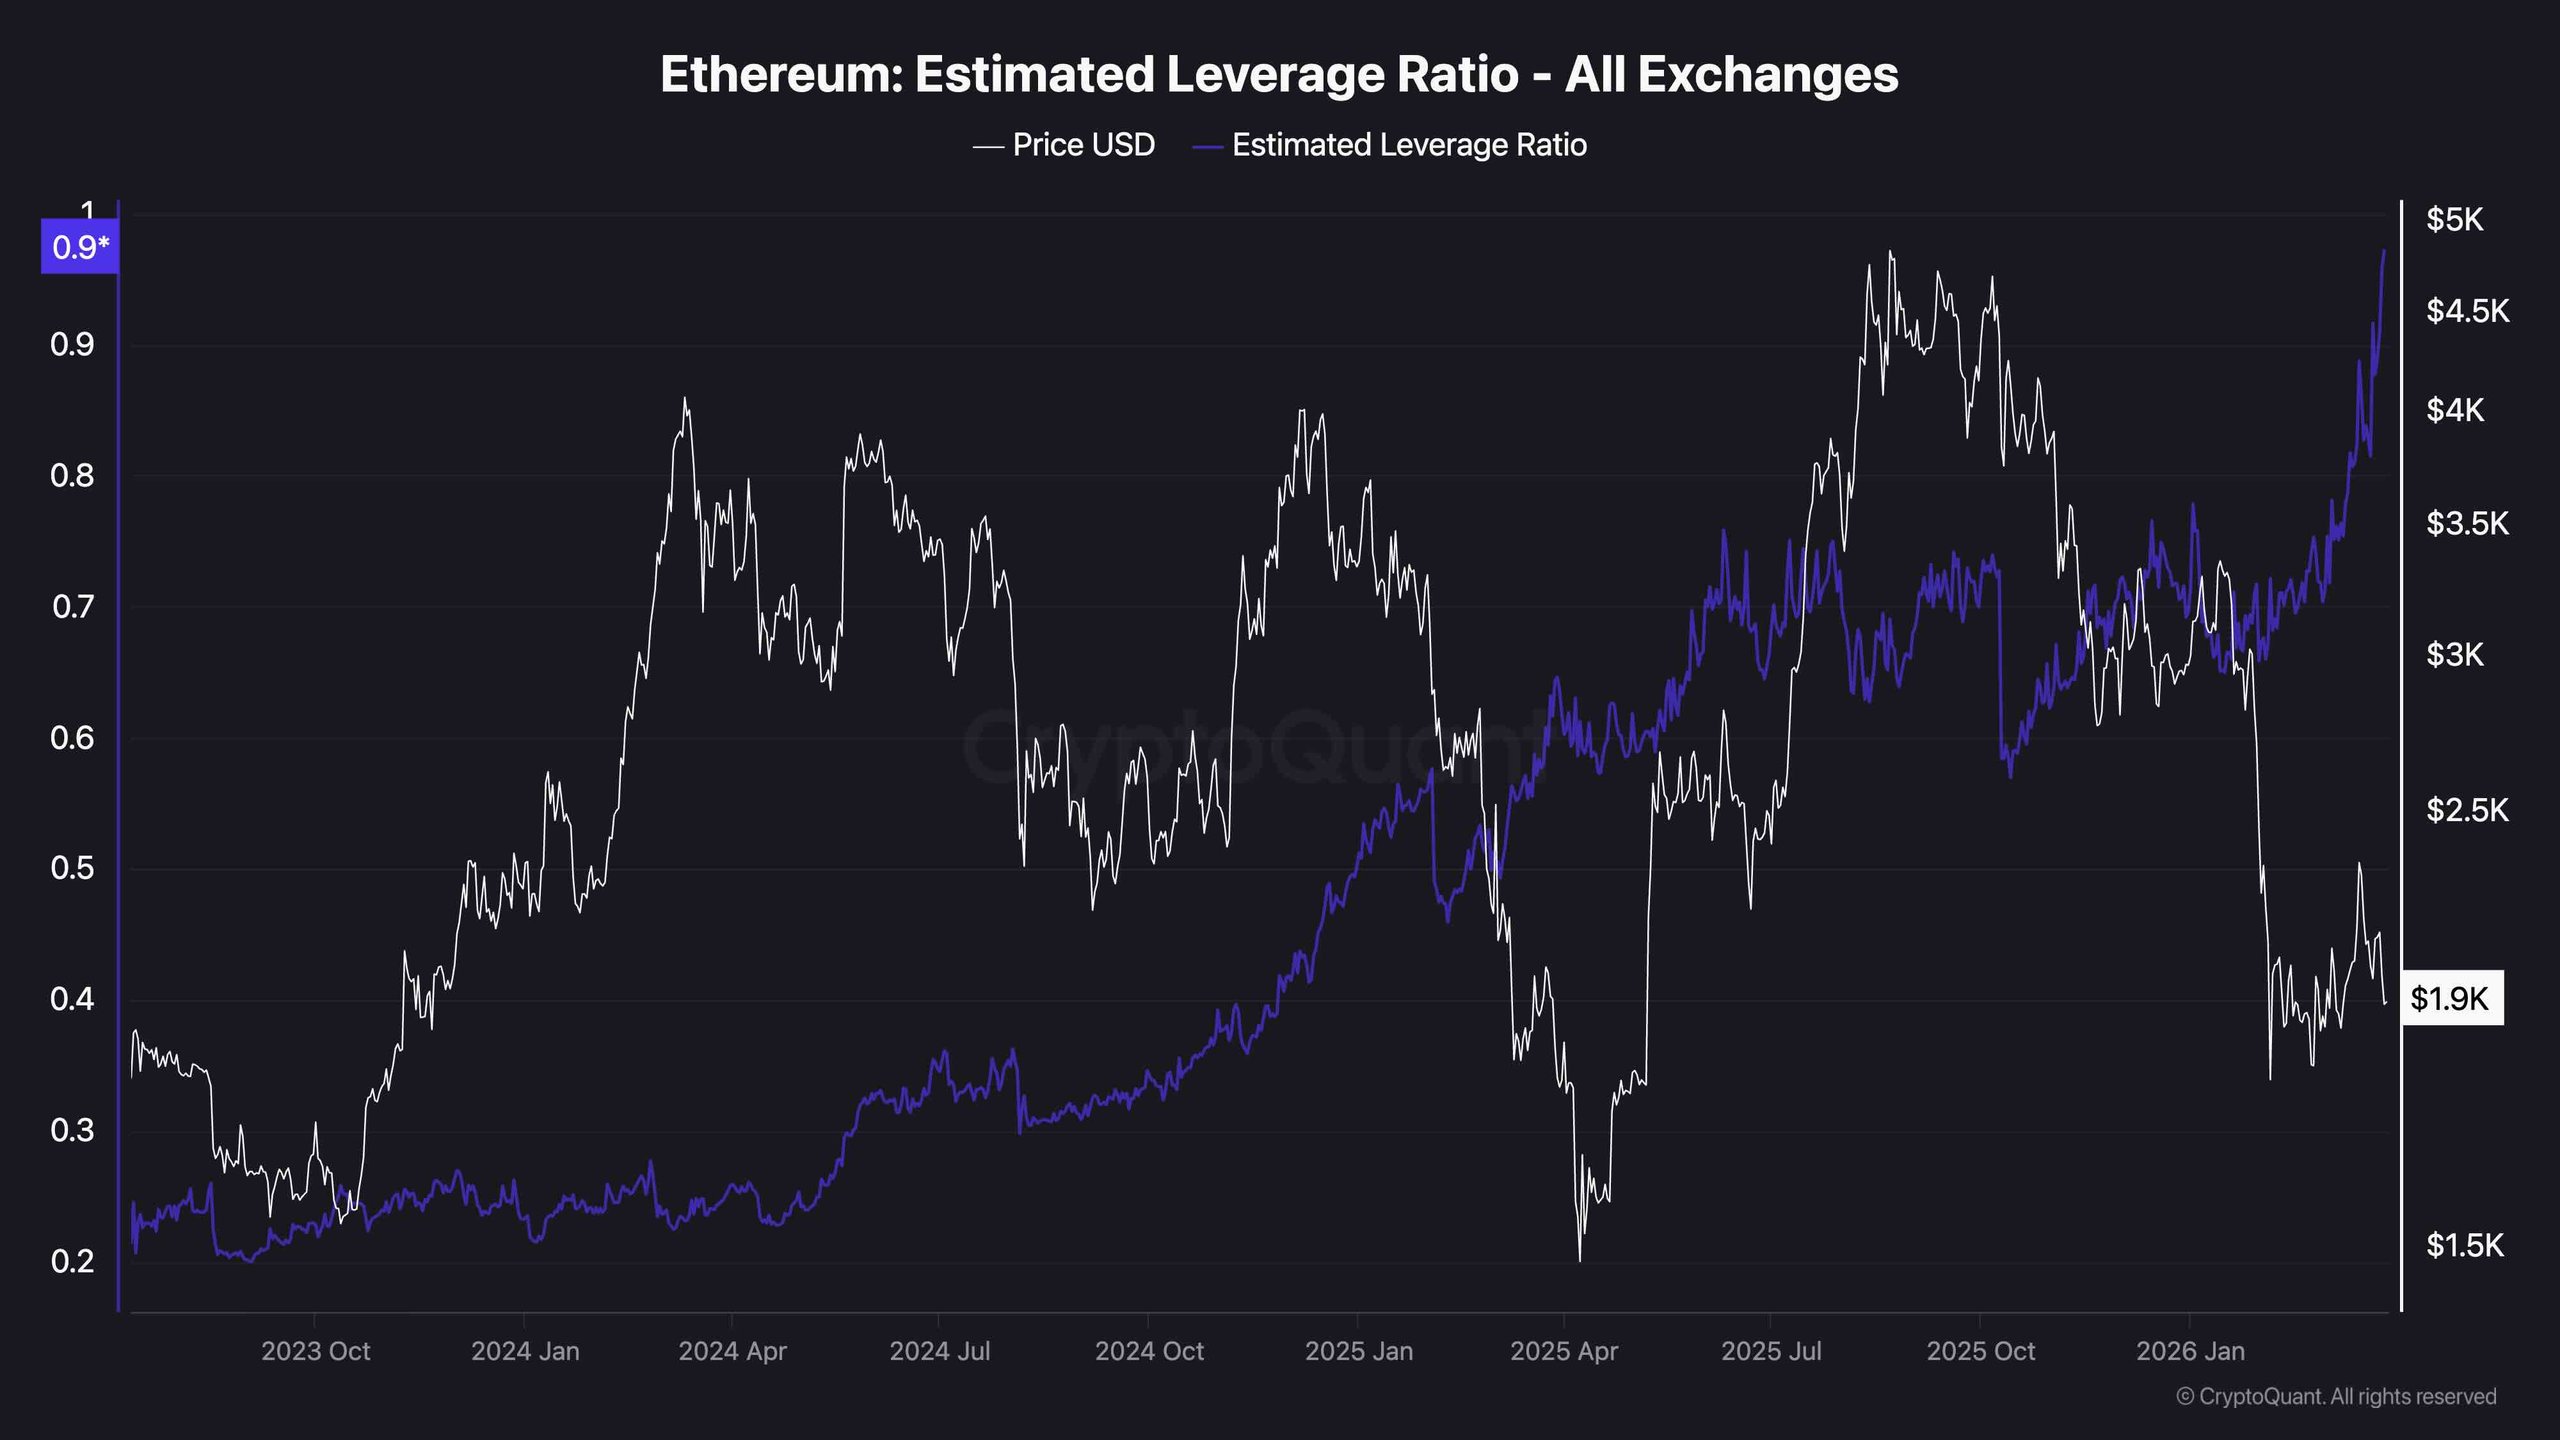
From a sentiment standpoint, the Estimated Leverage Ratio is raising red flags, as this metric has surged sharply, indicating a high level of leverage compared to previous periods. Elevated leverage typically foreshadows volatility since congested positions can trigger cascading liquidations in either direction. In the current scenario, with prices struggling below resistance, this presents significant downside risks if support levels commence to erode.
It’s important to note that while high leverage does not automatically denote a bearish outcome, it suggests increased fragility within the market. Coupled with a lack of robust demand to drive spot prices, sentiment appears precarious, which could lead to sharp price movements driven more by positioning than by genuine market demand.
 Leverage Ratio
Disclaimer: The information provided here is based on the analysis of the quoted authors and is not reflective of the opinions of the platform regarding investment decisions. We encourage conducting thorough research prior to making any financial commitments.
