


Bitcoin’s futures market has reached its highest open interest to date, signaling potential market movement in the near future. Analysts predict a possible liquidity flush within the next two weeks as volatility in BTC prices decreases. As of now, Bitcoin is hovering around the crucial support level of $120,000 as market participants strategize their positions.
Key Highlights:
- Bitcoin approaches $120,000 as liquidity on both sides increases.
- Analysts believe bullish maneuvers are correcting market imbalances to elevate prices.
- Ongoing bearish trends cast uncertainties on Bitcoin’s bullish trajectory.
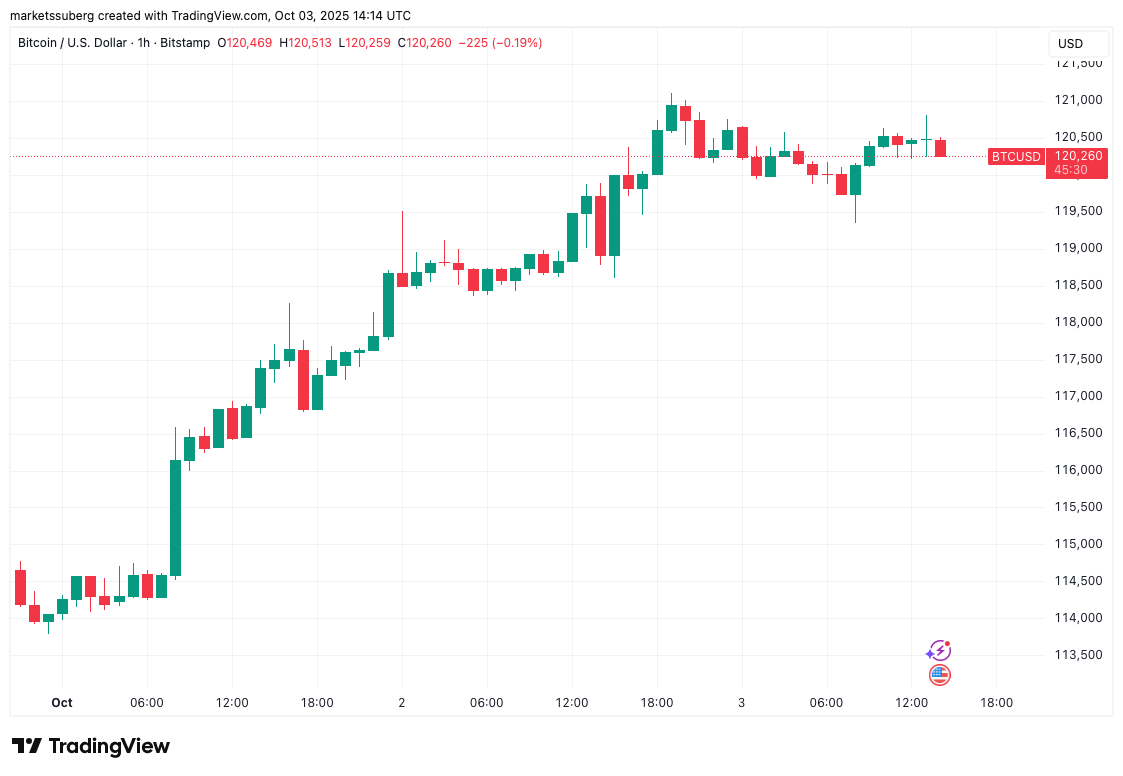 BTC/USD One-Hour Chart
BTC/USD one-hour chart. Source: Cointelegraph/TradingView
BTC/USD One-Hour Chart
BTC/USD one-hour chart. Source: Cointelegraph/TradingView
Trader Insight into $123,000 BTC Liquidity
Data from Cointelegraph Markets Pro and TradingView indicates a reduction in short-term BTC price volatility today, with a new daily high reached at $121,100.
Popular trader CrypNuevo has spotlighted $123,000 as the next liquidity target. He expressed in his latest analysis:
“Now we’re in this Liquidity Pool (LP) which represents an imbalance in the chart and needs to be fully retraced ($123.2k).”
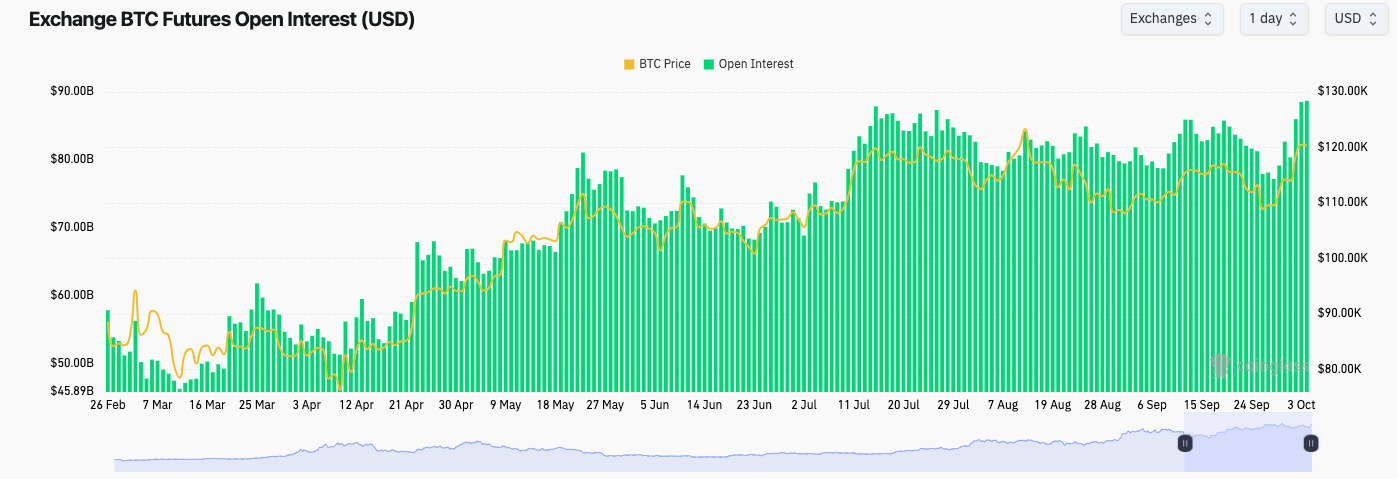 BTC Liquidation Heatmap
Exchange Bitcoin futures open interest data. Source: CoinGlass
BTC Liquidation Heatmap
Exchange Bitcoin futures open interest data. Source: CoinGlass
CoinGlass reported an all-time high for total futures open interest across exchanges at $88.7 billion today.
Concerns Over Bearish Divergences
Further arguments suggest potential struggles ahead as trader Roman highlighted concerning bearish relative strength index (RSI) divergences on both daily and weekly charts. “I wonder how long $BTC can ignore these bear divergences and lack of momentum on 1W and 1M,” Roman remarked.
“Volume indicates a weakness. It’s only a matter of time before these divergences manifest. Exercise caution in your positions.”
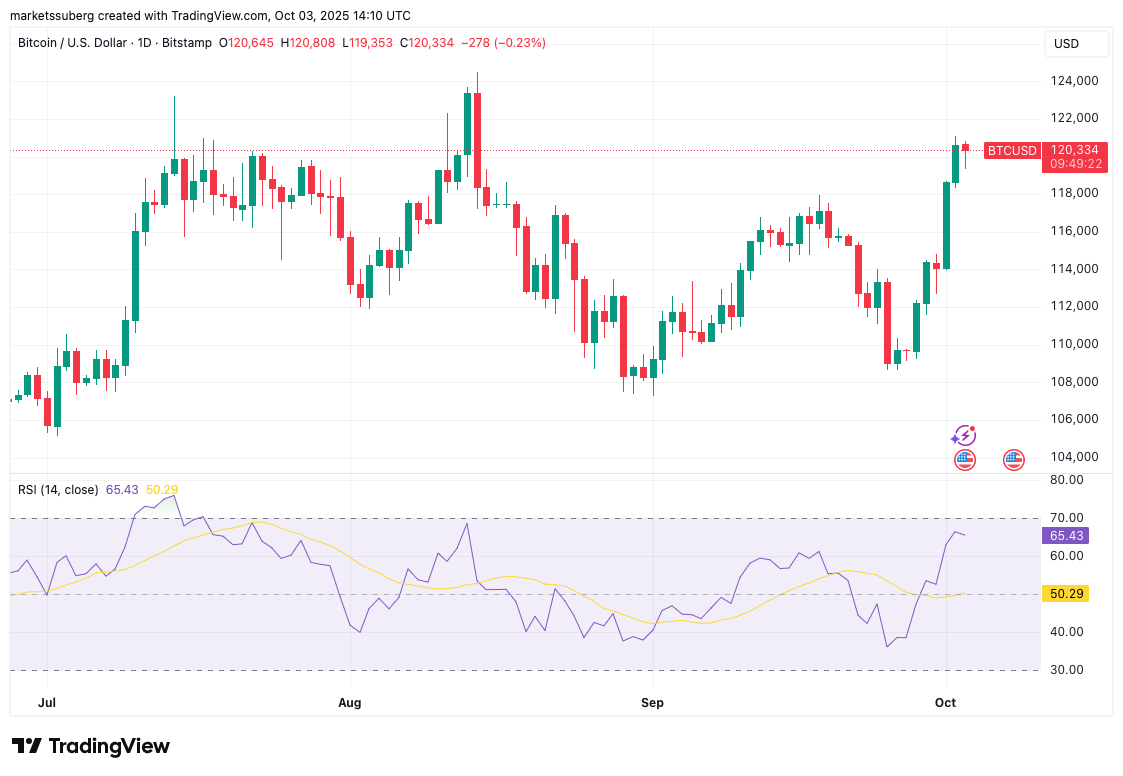 BTC One-Day Chart with RSI
BTC/USD one-day chart with RSI data. Source: Cointelegraph/TradingView
BTC One-Day Chart with RSI
BTC/USD one-day chart with RSI data. Source: Cointelegraph/TradingView
As reported by Cointelegraph, the four-hour RSI remains in “overbought” territory, suggesting possible price cooling.
Please note this article is for informational purposes only and not investment advice. Every investment carries risks, and it is vital to conduct thorough research before making decisions.
