XRP Price Evaluation: Potential for a Drop Below $3?
Exploring Ripple's current market position and price action trends.


Ripple is consolidating under a crucial descending resistance, developing a tight structure indicating a possible imminent breakout. The cryptocurrency remains above essential moving averages but is hindered by a notable multi-month trendline that has consistently rejected upward attempts.
XRP Price Assessment: Technical Insights
Daily Chart
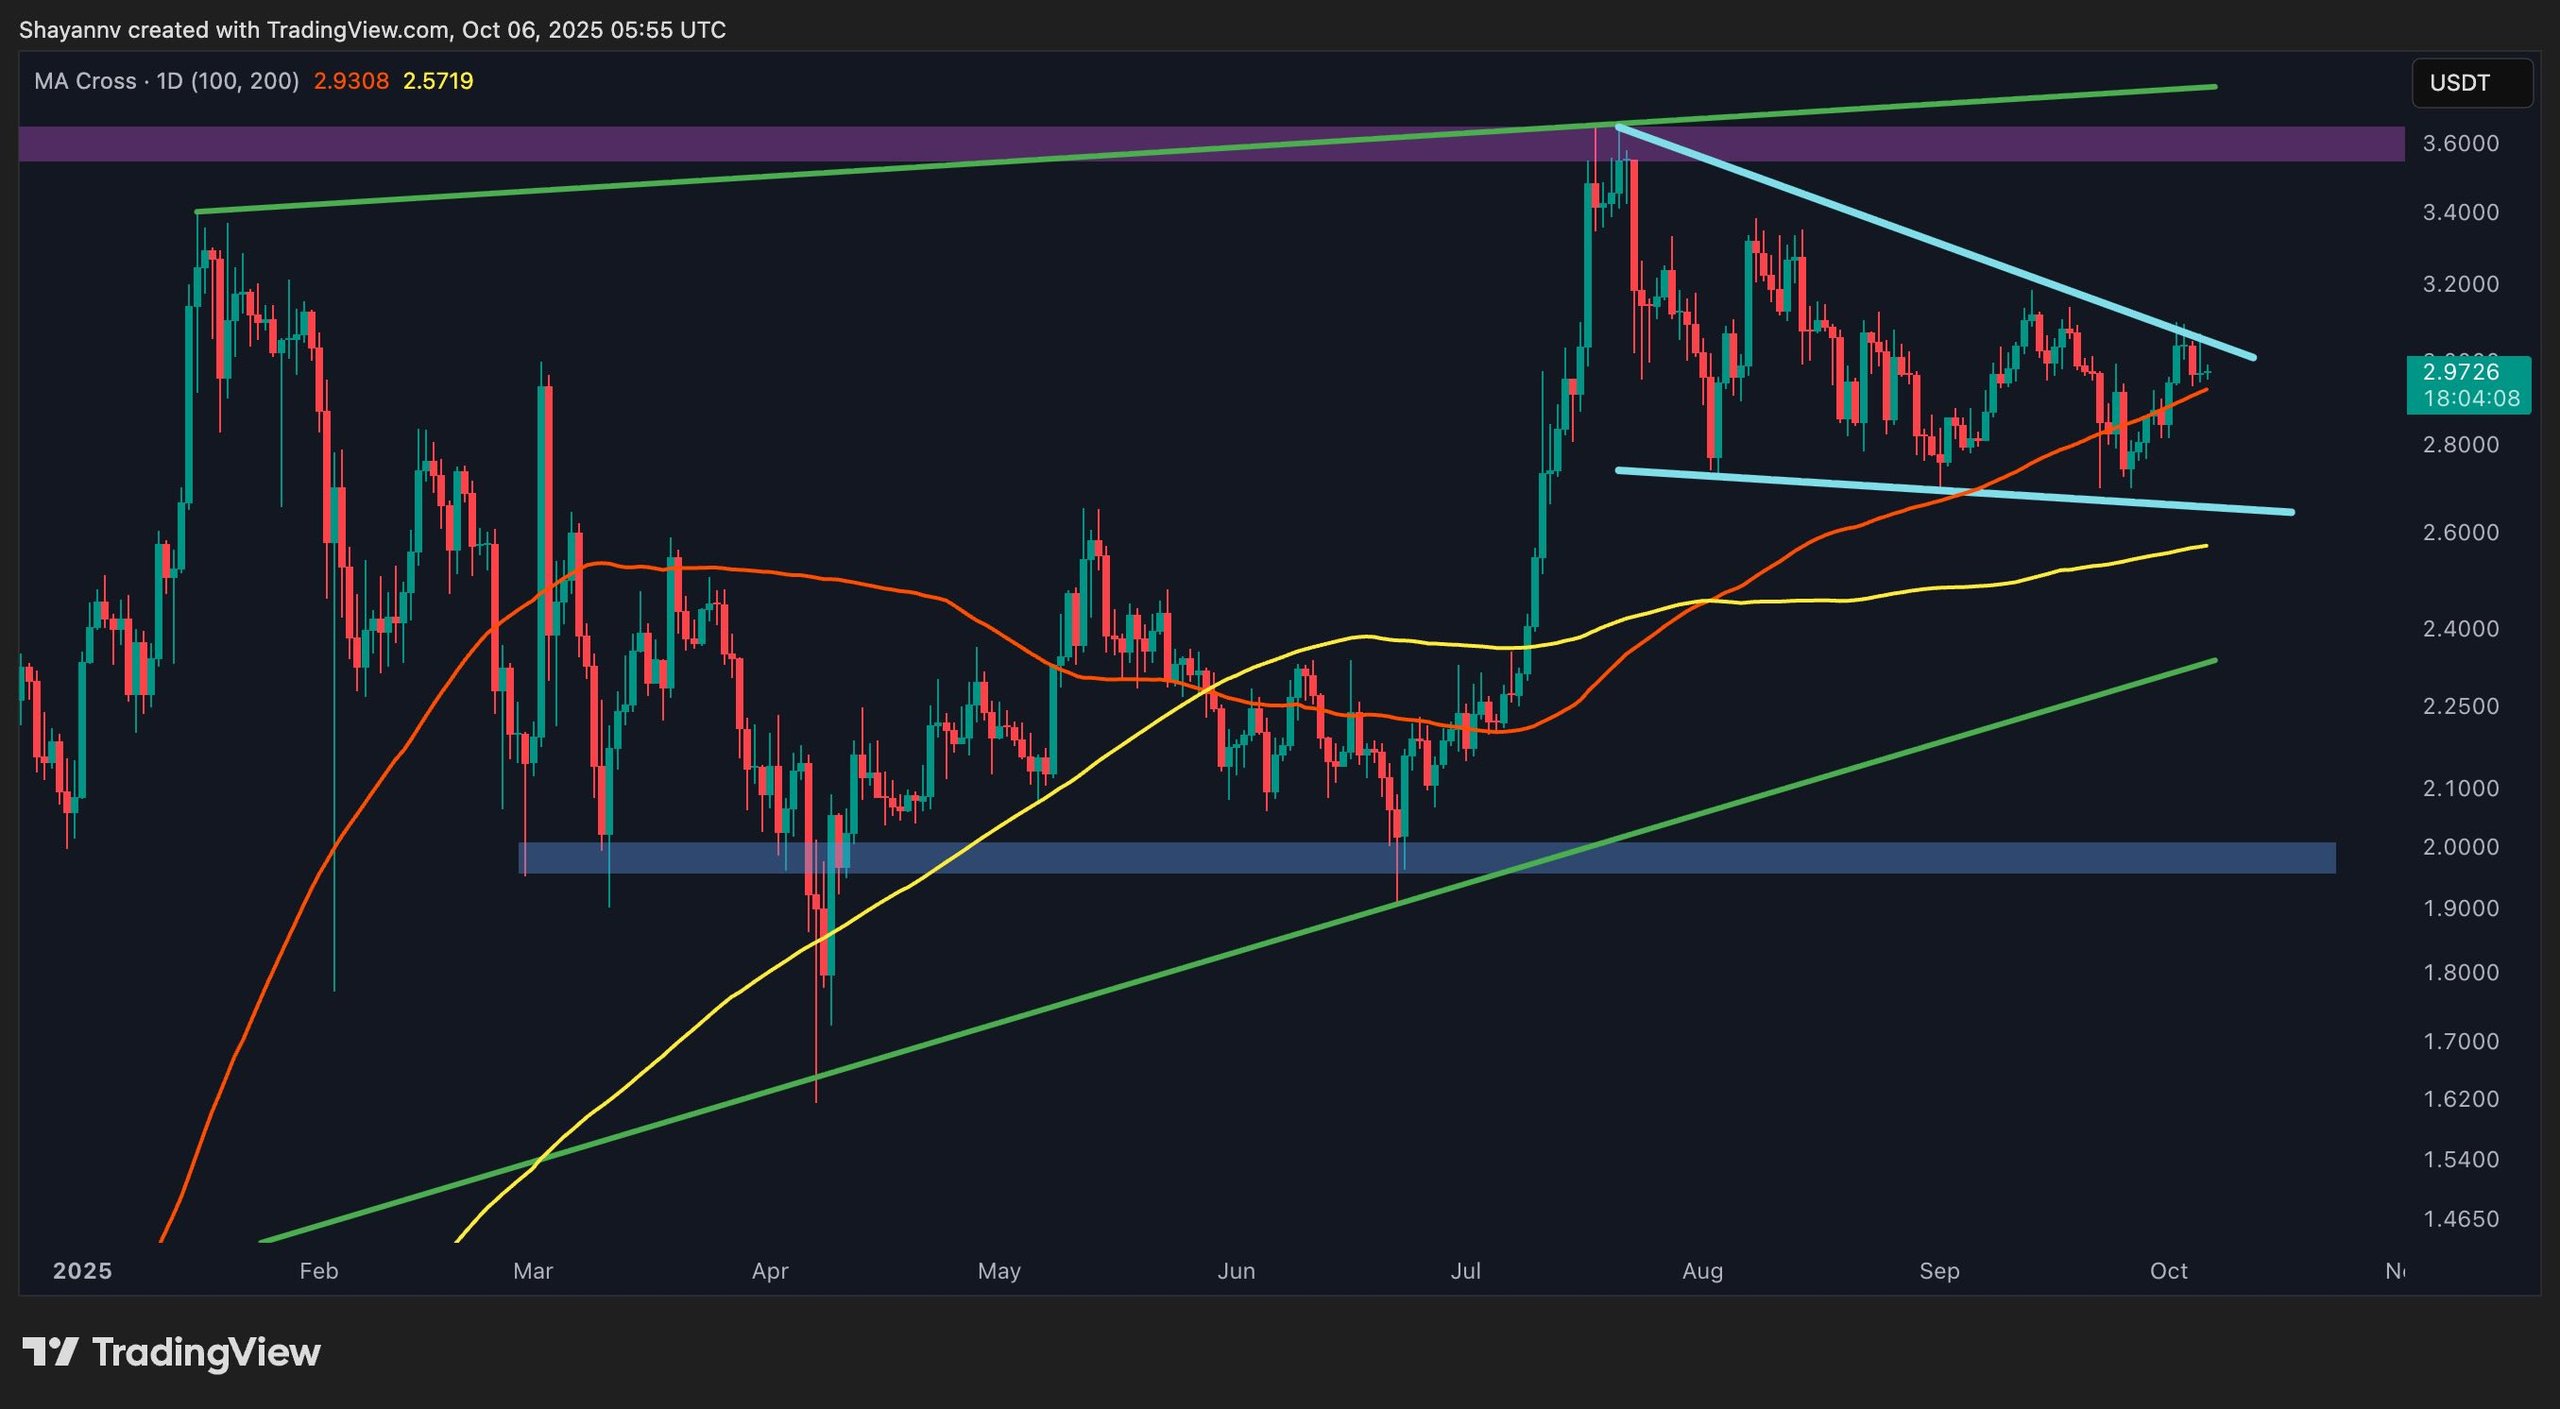
On the daily chart, XRP is operating within a converging wedge, characterized by a descending resistance line originating from the yearly peak and a rising support trendline. The price has reclaimed the 100-day and 200-day moving averages and has gone through a pullback, indicating improving bullish sentiment following a prolonged period of sideways trading.
At this moment, the market is testing the upper boundary of this wedge, approximately between $3.05 and $3.15, correlating with a significant supply zone that has historically obstructed upward movement. A decisive breakout past this point could pave the way toward $3.35 and subsequently $3.60, where major resistance and a higher-timeframe liquidity pool exist. However, if it fails to breach this level, another short-term pullback to the $2.75 to $2.80 region becomes plausible, aligning with the wedge’s lower boundary and near the 200-day MA, which is critical for sustaining bullish market momentum.
Daily Chart
Source: TradingView
4-Hour Chart
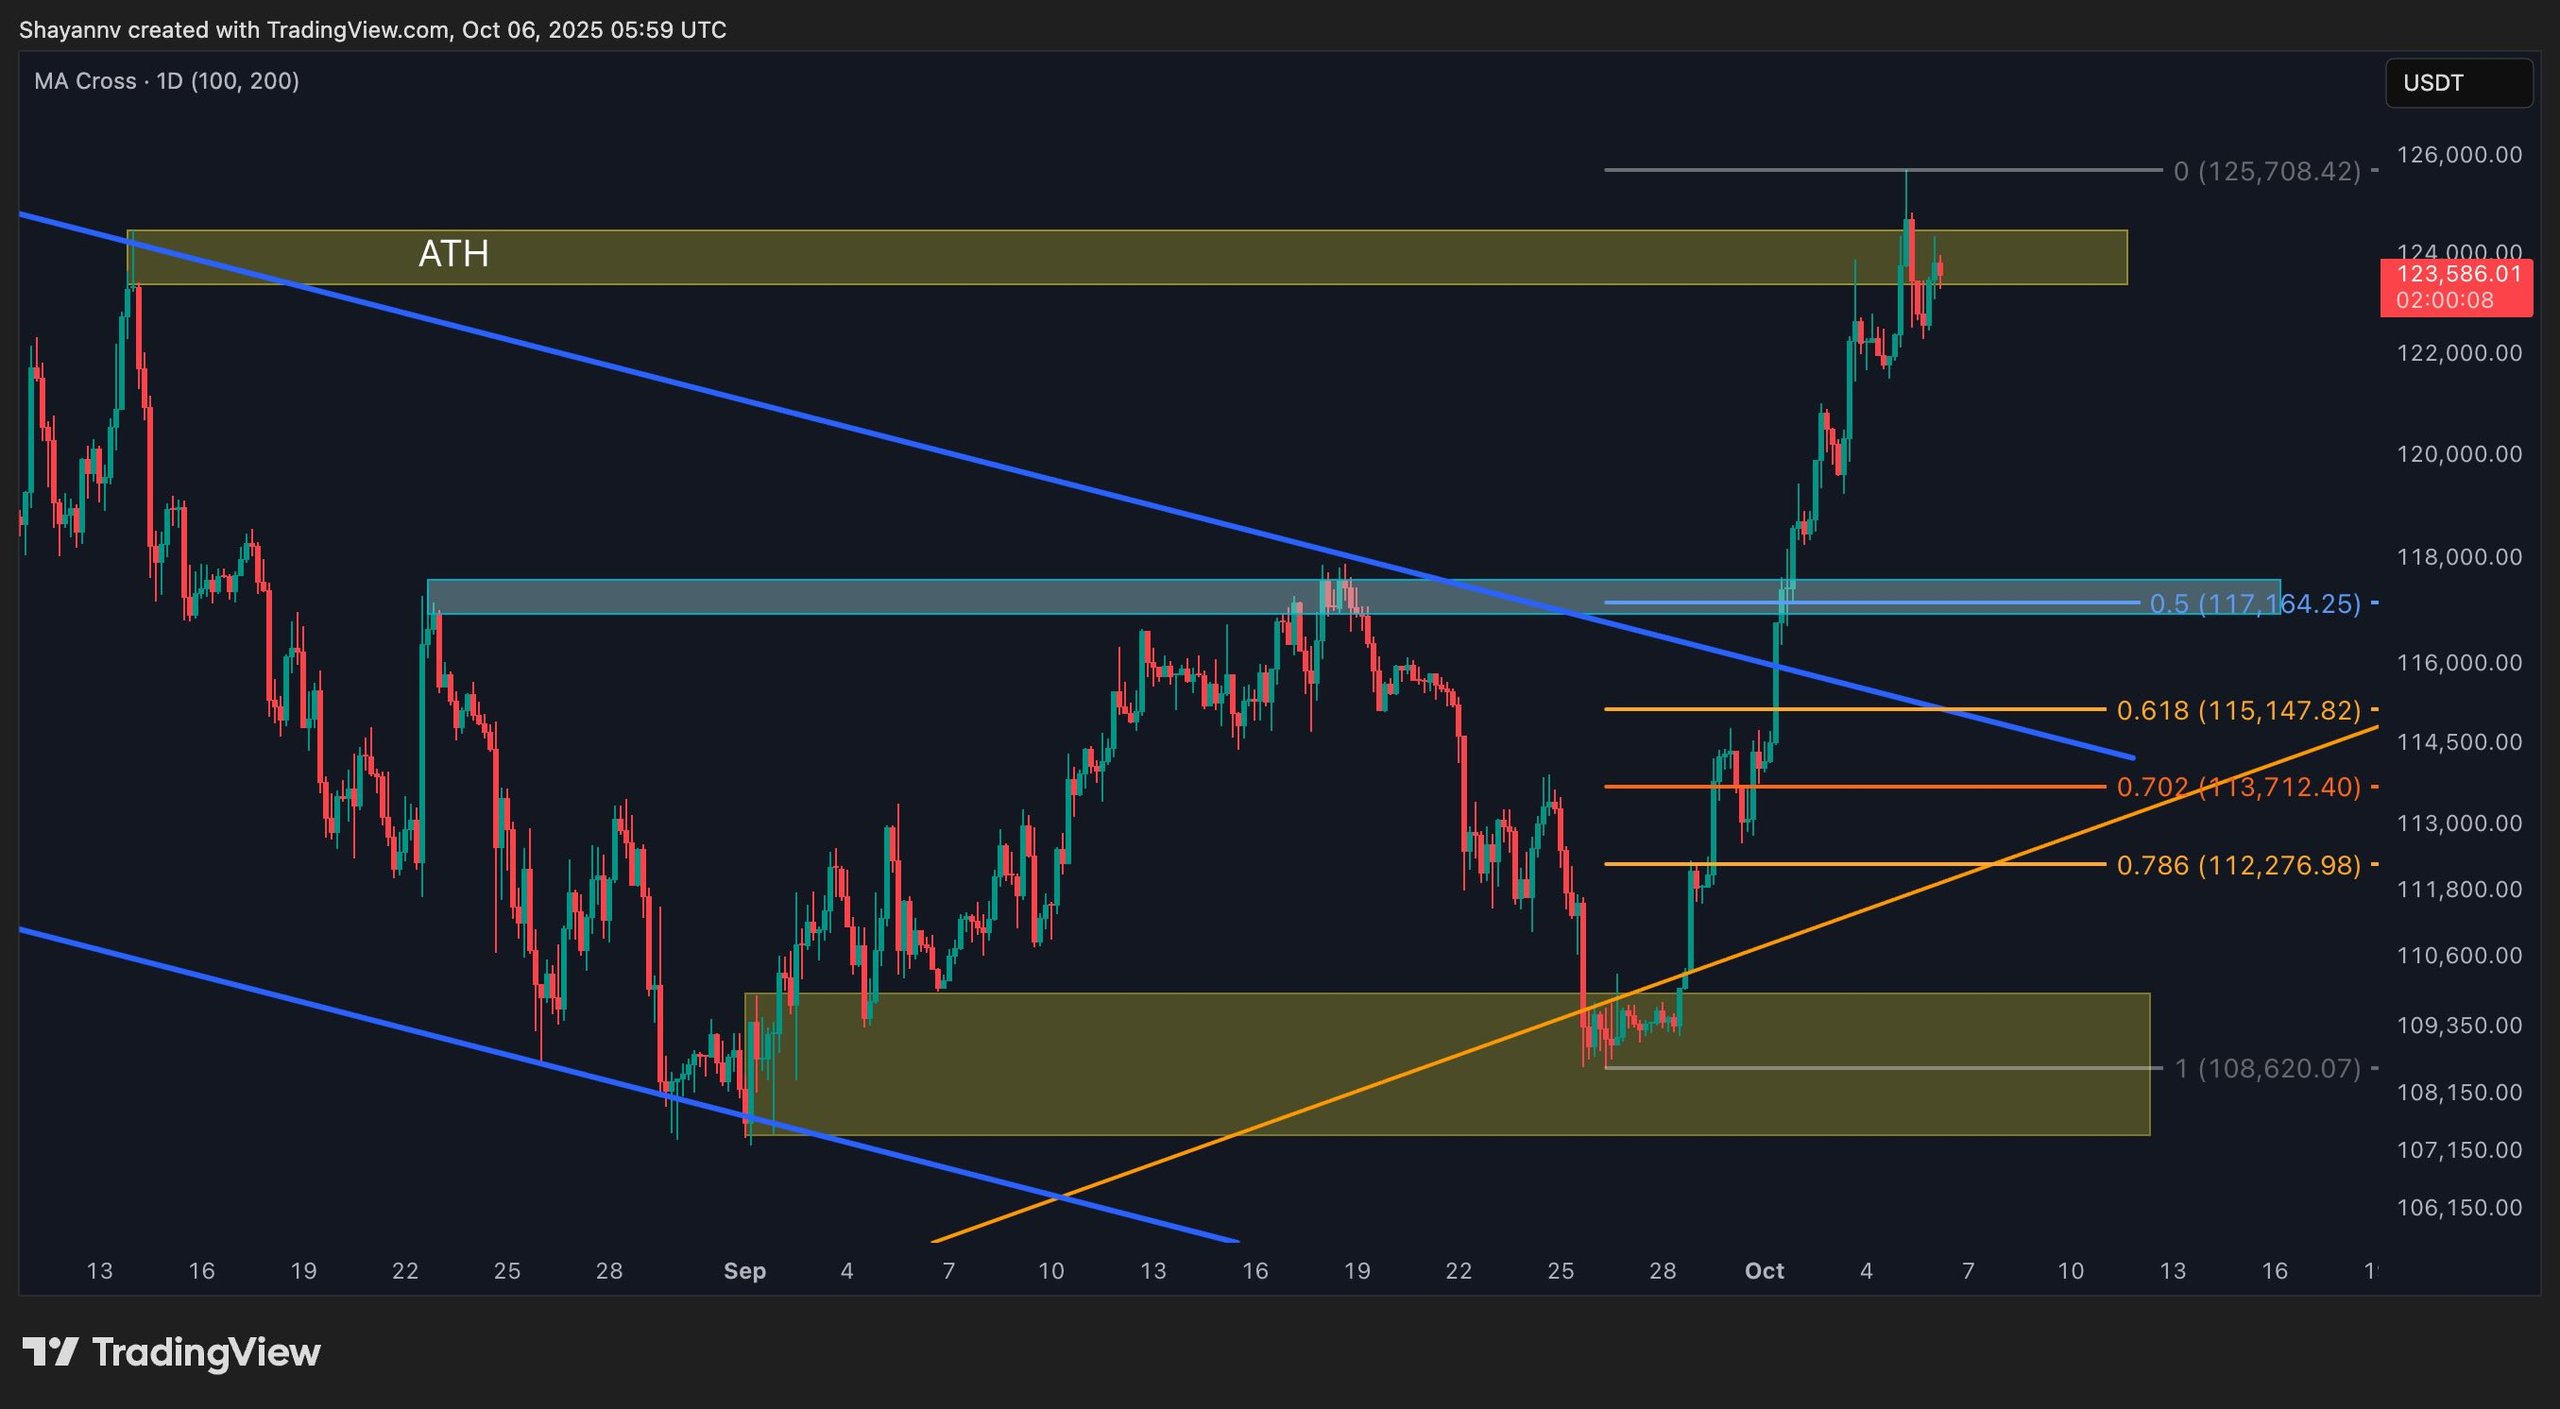
On the 4-hour chart, XRP continues to operate within a clearly defined downward trajectory. The recent pushback from $3.10 to $3.15 represents another test of the descending resistance trendline, keeping short-term traders cautious.
Despite this, the mid-range structure appears constructive, with the price establishing higher lows since late September, suggesting sustained demand each time it dips below $2.80. The current trading behavior hints at a tight coil, often a precursor to a significant directional movement.
If the price manages to break and maintain above $3.15, it could initiate a momentum-driven move toward the next resistance level at $3.35, followed by a liquidity sweep around $3.60. Conversely, if the rejection prevails, a retracement toward the $2.70 to $2.75 area remains feasible, aligning with the channel’s lower border and prior accumulation areas.
 4-Hour Chart
Source: TradingView
