
Dogecoin Price Forecast Shows Potential for 25% Increase After Key Resistance Break
Dogecoin needs to surpass the $0.20 resistance level for a price surge towards $0.25.


Dogecoin must surpass the $0.20 resistance to indicate a decrease in selling pressure, which may propel the DOGE price past $0.25.
Key takeaways:
- Dogecoin must break through the $0.20 resistance to trigger a breakout from consolidation.
- The DOGE price needs to confirm a symmetrical triangle pattern to secure gains to $0.25.
Dogecoin’s * (DOGE) * 7.5% rise from local lows below $0.18 appears to be stabilizing, but traders maintain that DOGE is poised to “continue its upward trend” toward higher targets in 2025.
Several indicators highlight what needs to occur for Dogecoin to enhance its likelihood of breaking out of consolidation in the near future.
Dogecoin Must Break $0.20 Resistance
Dogecoin’s bullish expectations rely on the DOGE/USD trading pair flipping the resistance between $0.20 and $0.22 into support.
“DOGE is currently consolidating near $0.19 after a notable drop,” crypto analyst HODL Gentleman stated in a recent post, adding: “A clear break above $0.20 is vital to signal a trend reversal. Watch that level!”
This level coincides with the 200-day simple moving average (SMA), as illustrated in the chart below.
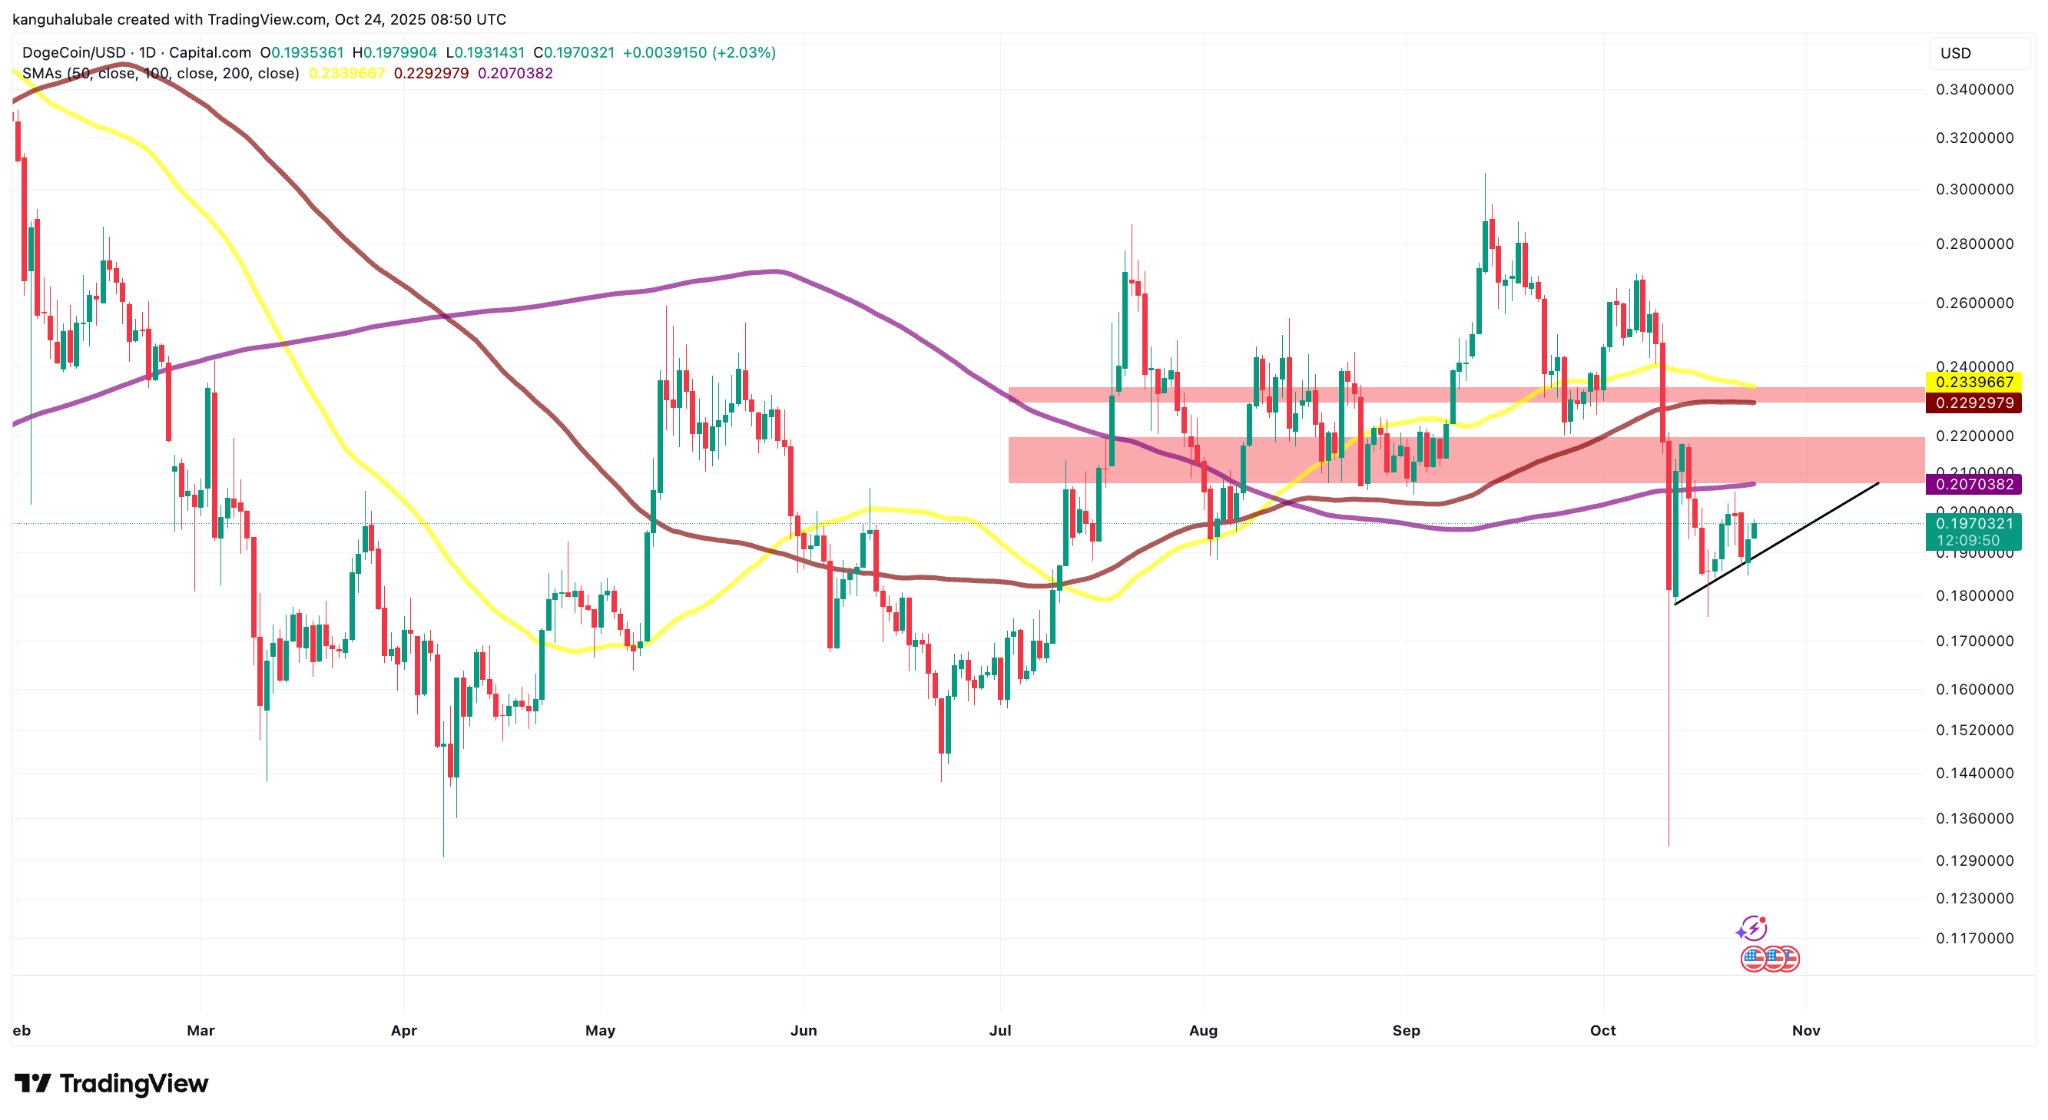 DOGE/USD daily chart. Source: Cointelegraph/TradingView
The Glassnode distribution heatmap indicates a significant accumulation of supply located in the $0.20-$0.21 range, where almost 24.9 billion DOGE were recently obtained, highlighting the significance of this resistance.
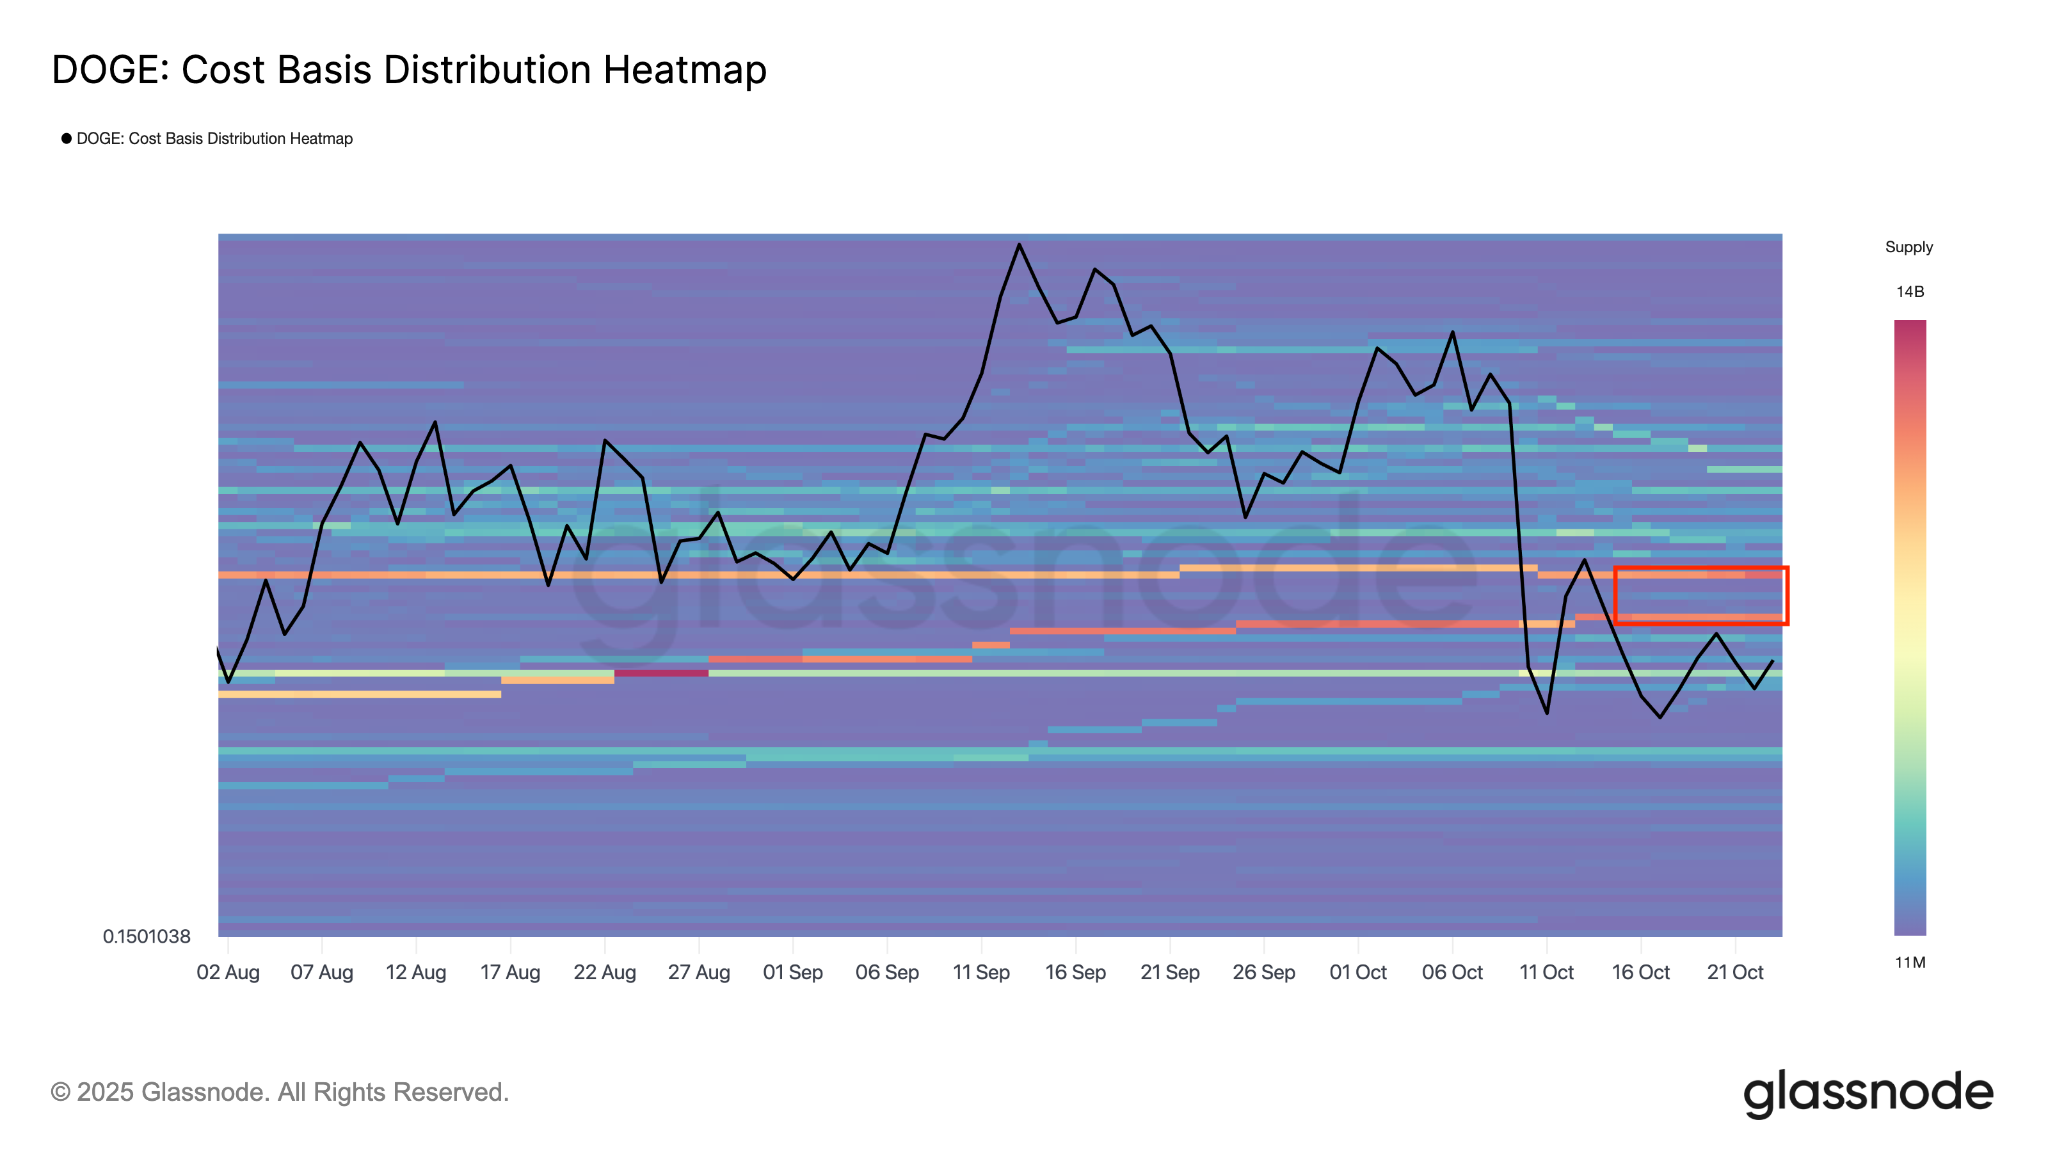 Dogecoin’s cost basis distribution heatmap. Source: Glassnode
Moreover, another resistance zone lies within the $0.23-$0.24 area, reinforced by the 100-day and 50-day SMAs, respectively.
If the 20-day EMA, currently at $0.22, is surpassed, it would indicate diminishing selling pressure. Should this occur, the DOGE price might rise to the 50-day SMA at $0.23 and later to stronger overhead resistance at $0.29.
DOGE Must Confirm Symmetrical Triangle Breakout
Data from Cointelegraph Markets Pro and TradingView shows DOGE trading within a symmetrical triangle on the four-hour timeframe.
The price needs to close above the upper trendline of the triangle at $0.20 to affirm a bullish breakout, with a measured target of $0.246.
This movement would result in a total gain of 25% from the current level.
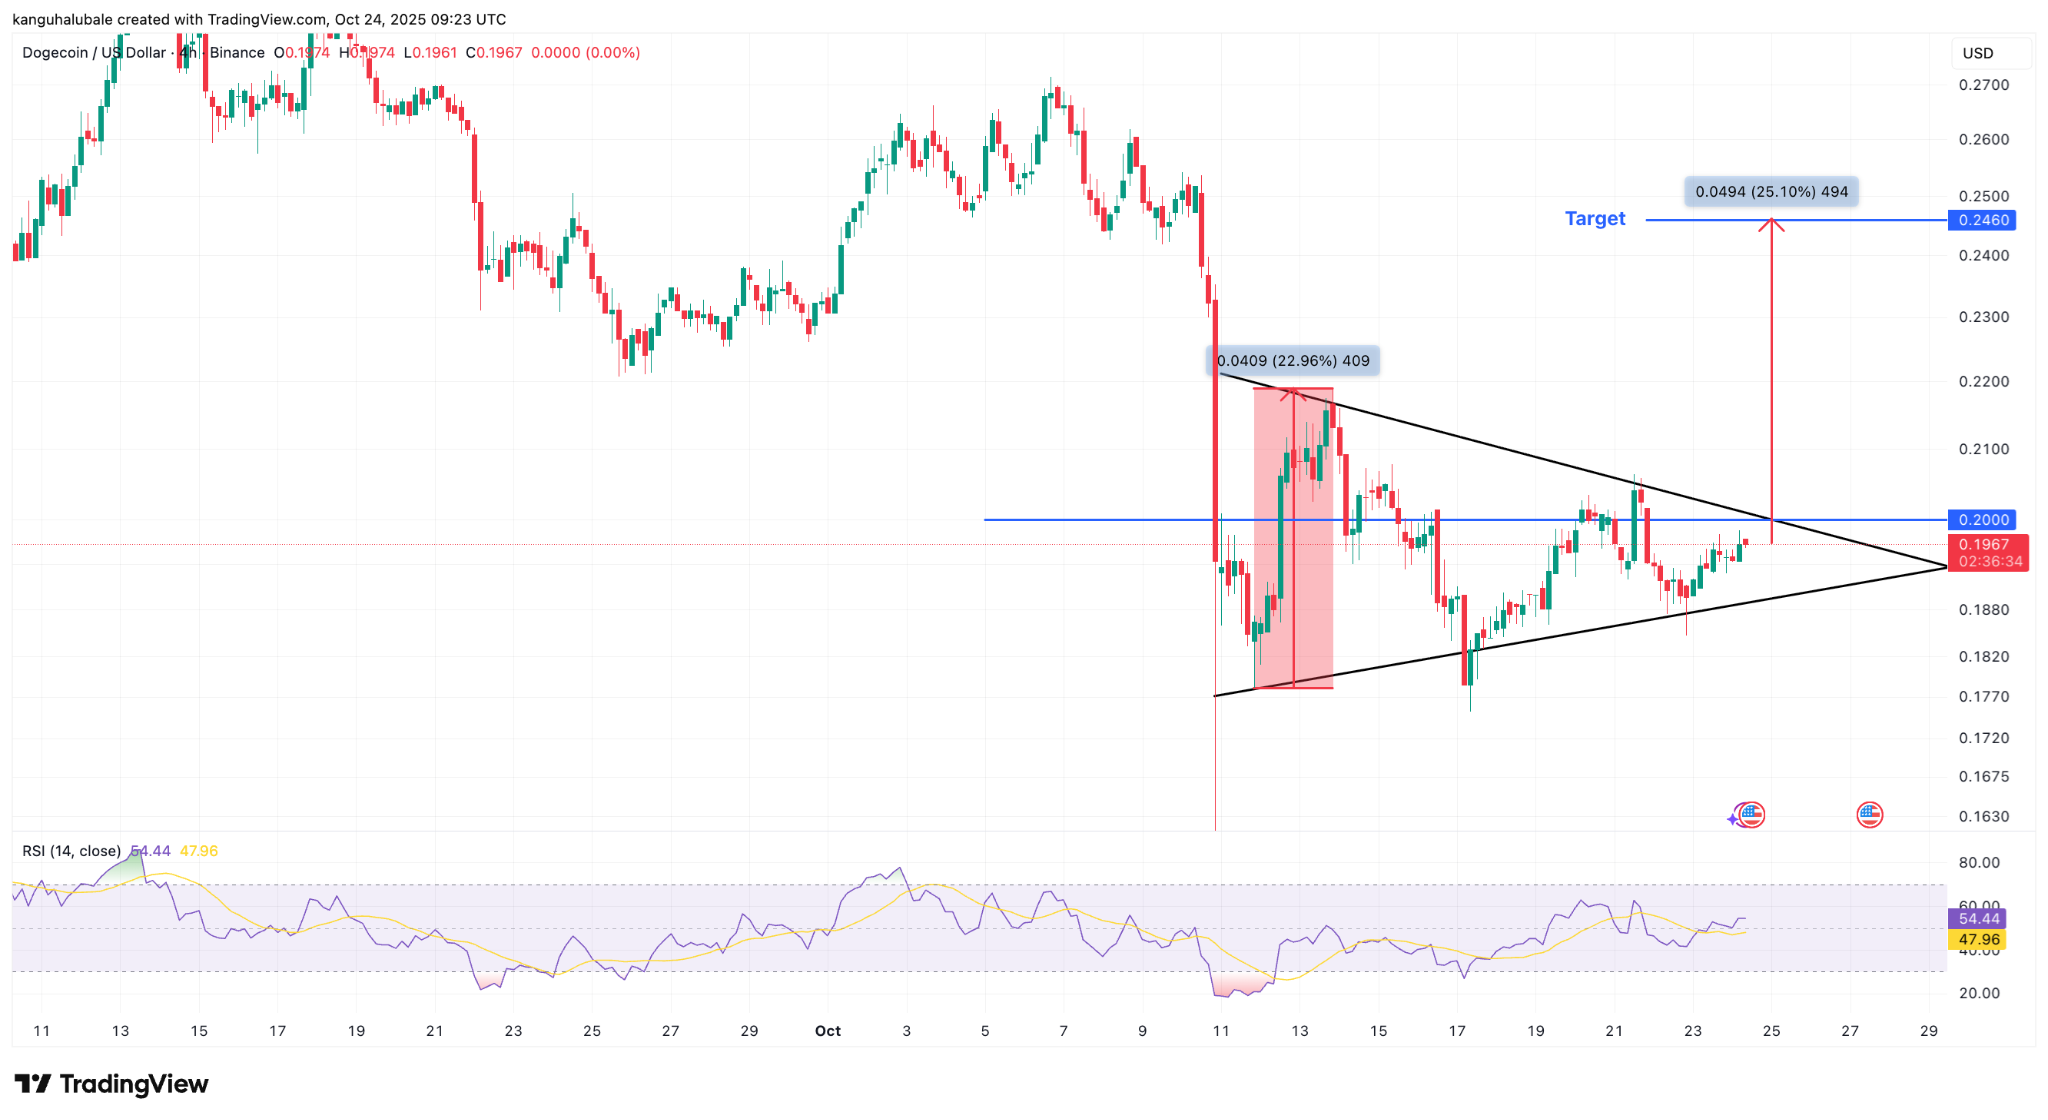 DOGE/USD four-hour chart. Source: Cointelegraph/TradingView
“Dogecoin continues its upward trend after breaking out of a falling wedge” on the four-hour chart, analyst Trader Tardigrade noted.
The measured target of the falling wedge is $0.216, indicating a 6.5% short-term price increase.
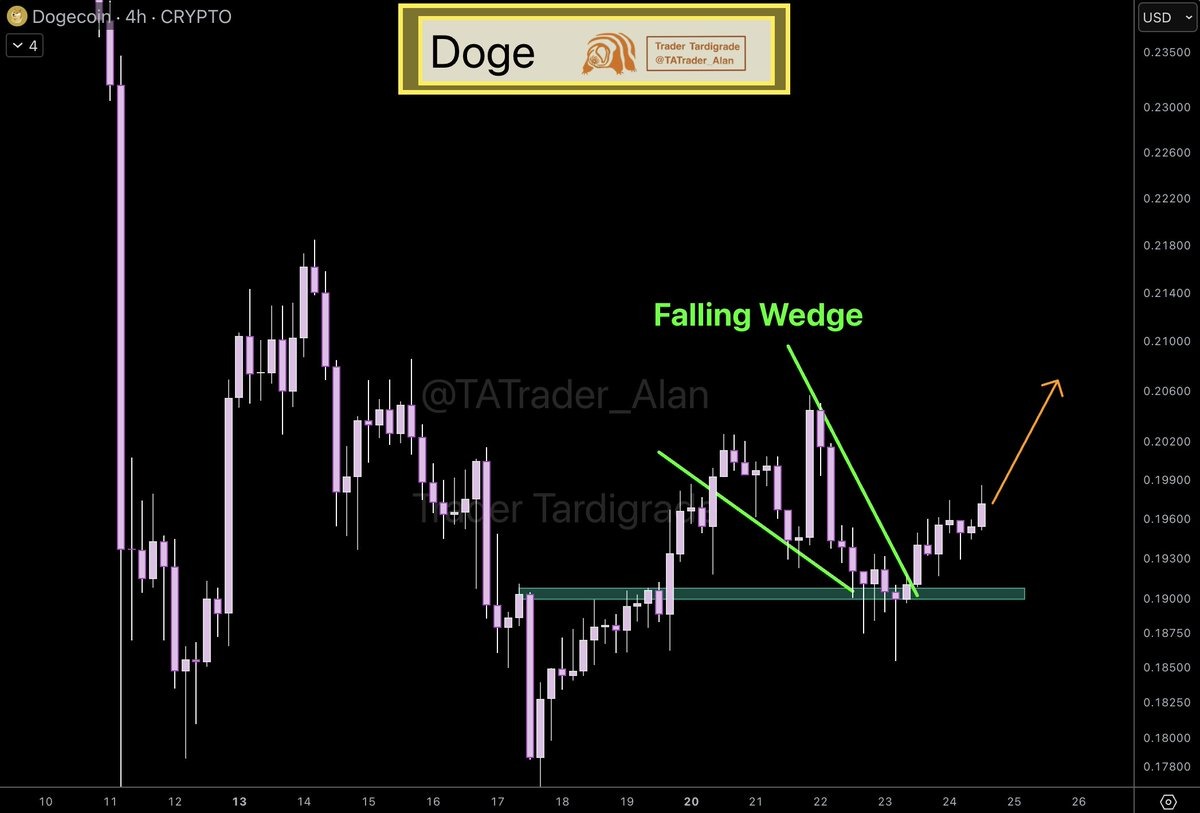 DOGE/USD four-hour chart. Source: Trader Tardigrade
Another analyst, Bitcoinsensus, provided a more optimistic prediction, stating that “Doge could see prices soar between $5-$7” if it follows a similar market structure to that seen in past cycles.
$DOGE MONTHLY MACRO CYCLES 📐📈
Could $7 be the next target in this cycle?
Historically, Dogecoin follows a similar market pattern, culminating in a significant surge at the end of the cycle.
If we were to replicate the same trends, Doge could reach… pic.twitter.com/eWlrPhKHvV
This article does not offer investment advice. Every trading decision involves risk, and readers should perform their own research before proceeding.
