Ethereum Price Trends: Is the $3K Support at Risk as Selling Pressure Grows?
Ethereum's price has dropped below $3,300, showing signs of bearish momentum. Analysts are watching critical levels as the market fluctuates.


Ethereum has recently fallen below the $3,300 threshold, illustrating ongoing selling pressure in this segment. Although bears have not yet shown significant strength, the price drop, particularly after a major liquidation, raises concerns of additional declines. Spot sellers may be gaining influence, potentially leading to a steeper short-term retracement.
Technical Analysis
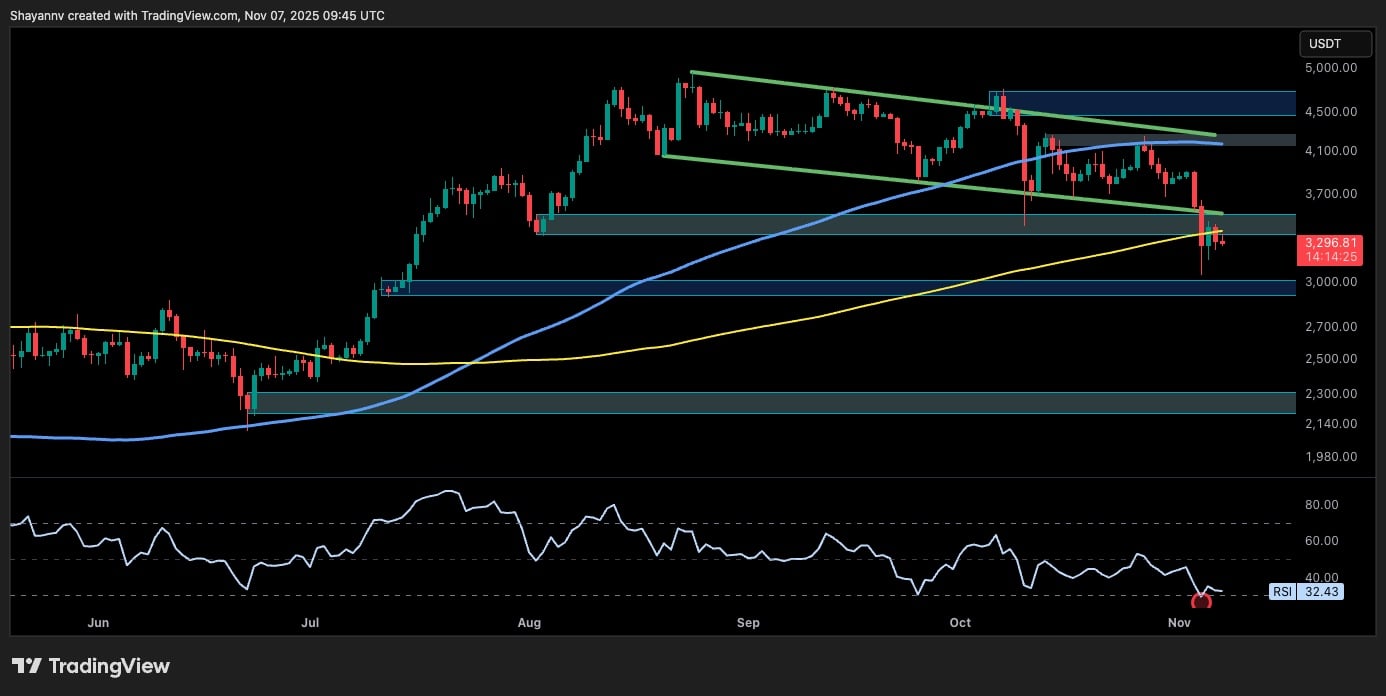
The Daily Chart
ETH has breached its channel and dipped slightly beneath the 200-day moving average. It is now losing the essential $3,300 demand zone—critical for assessing bullish or bearish trends. With the RSI stuck at 32, showing weakness, ETH needs to surpass $3,500 and convert that area along with the 200-day moving average into support. Until then, risk remains high for further drops towards the $3,000 support in the days ahead.
Daily Chart
The 4-Hour Chart
Observing the 4-hour chart, we see a rapid rejection from the lower limit of the broken channel and previous support, around $3,400. The price struggles to maintain a convincing recovery or higher low. The RSI remains below 50%, emphasizing a bearish trend as ETH flirts with the $3,300 level, increasing the likelihood of quick moves toward the $3,000 zone.
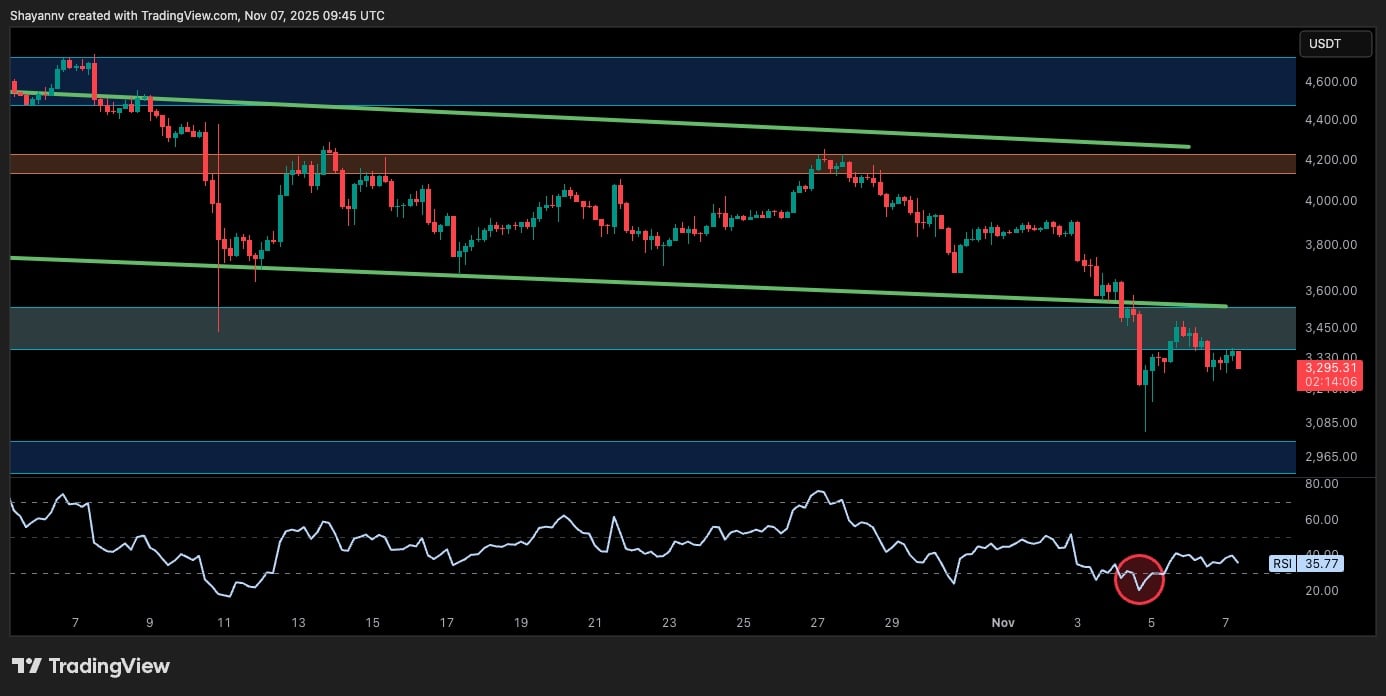 4-Hour Chart
Sentiment Analysis
Long Liquidations
From a sentiment perspective, recent liquidations have eliminated a significant portion of recent long positions, presenting an opportunity for price stabilization. Although the RSI nears oversold conditions, caution prevails among traders who are likely to withhold from recent positions unless clarity strengthens the market outlook, particularly a reclaim of $3,500. Conversely, a fall towards $3,000 could trigger another wave of liquidations, risking even more severe declines in the subsequent weeks.
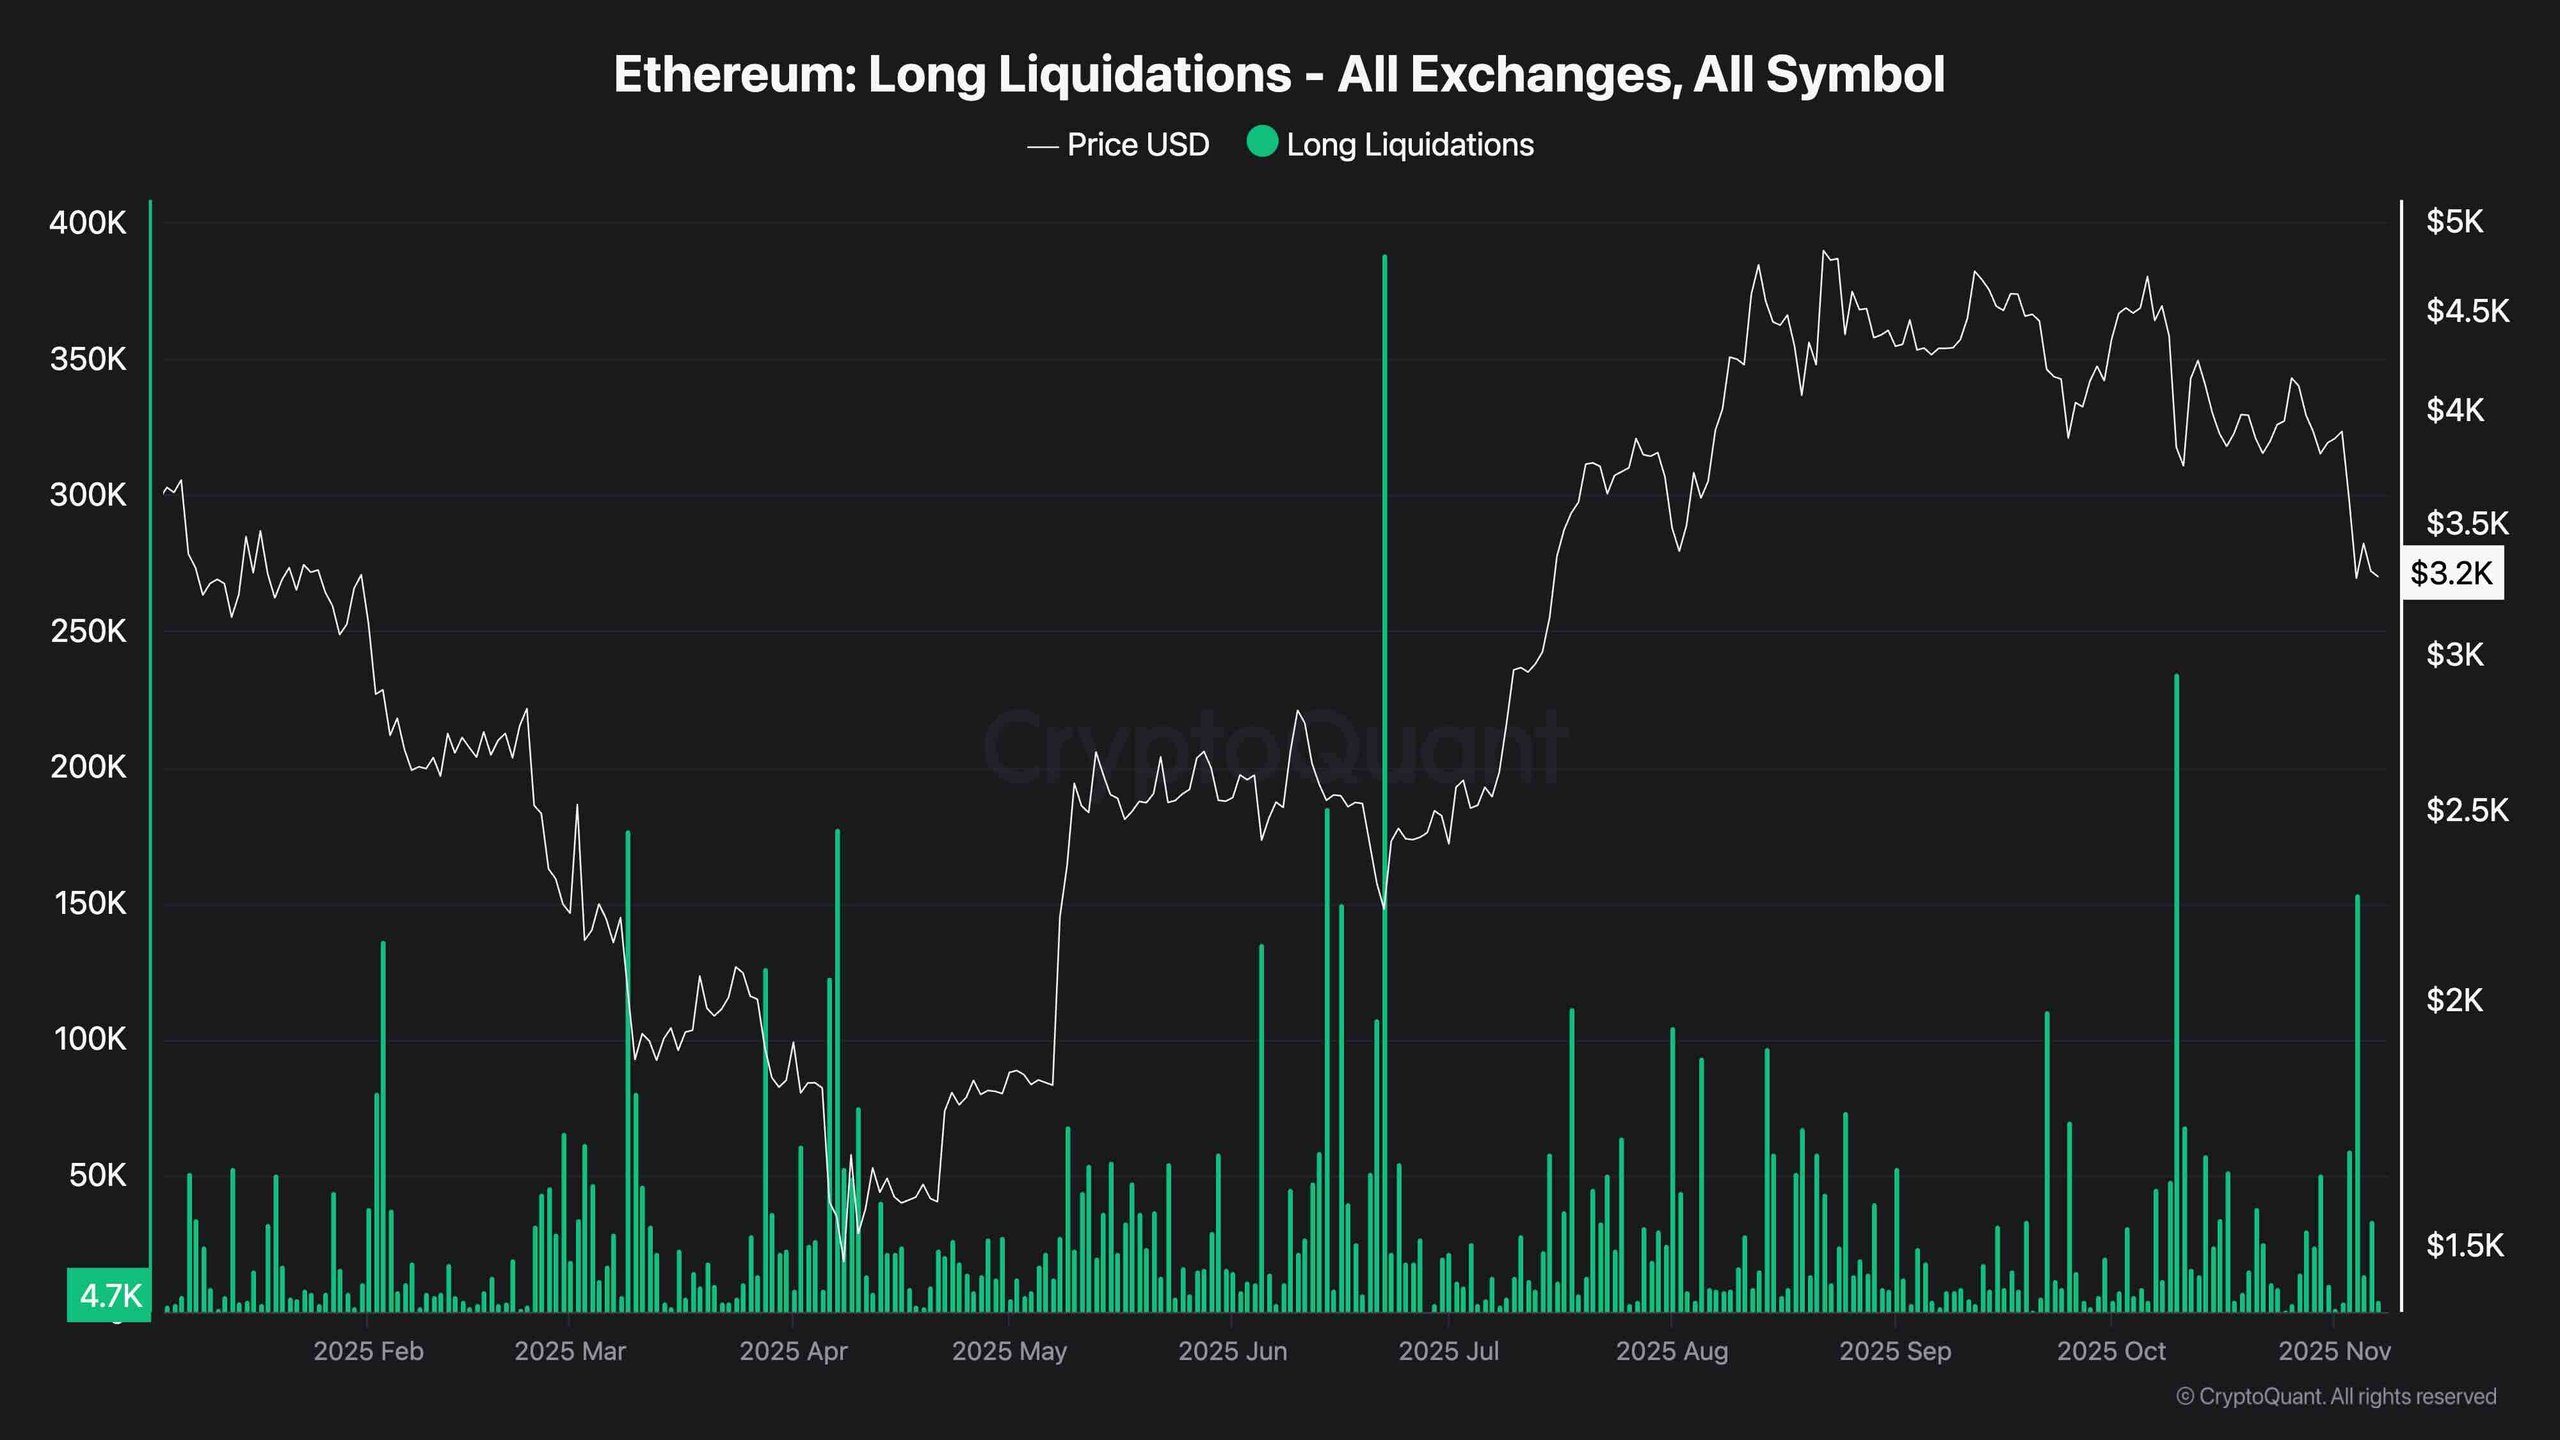 Liquidations Chart
Conclusion
Avoid assumptions about the market’s direction; keen analysis and market conditions should dictate trading strategies.
